Previously…
The first article of the series (basically the origin story for the model) can be found here. To summarise, I’ve trained an expected goals (xG) model and applied it to RLCS Season 6 League Play.
The calculated stats and visualisations are here:
2D shot charts: https://imgur.com/a/iegdnoi
3D interactive shot chart: http://blog.calculated.gg/files/xG.html
Spreadsheet: https://docs.google.com/spreadsheets/d/e/2PACX-1vTKx7TQRj67P6tSb21lIAMx3x7qAxQzZUdV3UZld6aIsvhynbY8jIzUj7e5dTfZpoMKXxeR4jFXXxm3/pubhtml#
Diving into the Data
The previous article covered the generation of expected goals (xG). In this article, I will be going over highlights from the data, and what conclusions can be drawn from them. I’ll compare regions, teams, and individual players. Now, let’s have a look at the data!
Regions
Players’ and teams’ xG stats are roughly equal between regions, usually with a difference of <2 standard errors. There is a trend, however, of EU having fewer chances (xG per game and xGa per game) compared to NA. This reflects the way EU plays more defensively than NA, and with a less-direct approach.
Teams
Chance conversion: goals per xG. Dignitas were the kings of converting their chances while preventing opponents from converting theirs, having both the highest goals per xG average (1.7) and the lowest goals conceded per xGa average (0.7). On the other side of the spectrum, compLexity struggled to score, averaging 0.9 goals per xG, while PSG faced problems preventing shots from entering their net, with an average of 1.3 goals conceded per xGa.
Shot selection: average xG per shot. WDG found themselves taking some of the easier shots in EU (0.22 average xG per shot), while C9 (0.24), Rogue (0.23), and EG (0.22) all found their way to easier shots in NA. compLexity (0.18) tended to take harder shots (and the same can be said about Ghost (0.19) and NRG (0.19), though to a lesser extent).
Chance generation: xG per game. Dignitas, the kings of shot-conversion, happened to find themselves with a deluge of chances each game (each player averaging 0.53 xG per game), second only to C9’s incredible player-average of 0.62 xG per game. Teams who found themselves unable to create meaningful chances include mousesports (0.38), compLexity (0.39), Ghost (0.40), Rogue (0.41), and Fnatic (0.41).
Goalkeeping: goals conceded per xGa. In defence, Dignitas easily stopped whatever offences threw at them with 0.7 goals conceded per xGa; Ghost were second with 0.76 goals conceded per xGa. PSG had a nightmare of a time, letting in 1.3 goals per xGa. Other bad-performers in defence include G2 (1.2) and NRG (1.1).
Offence-suppression (difficulty): average xGa per defence. Being able to limit defences to harder shots, WDG (0.145) and C9 (0.150) faced an average xGa per defence defended of 0.15 while Allegiance (0.23), Fnatic (0.22), and FlyQuest (0.21) tended to give up easier shots.
Offence-suppression (total value of chances): xGa per game. In terms of limiting the total value of opponents’ chances, WDG (0.42 xGa per game) and PSG (0.42) come out on top. FlyQuest’s unique 3-0-0 formation (see image below) gives the opponents plenty of chances (0.73), while Allegiance (0.70), Rogue (0.68), Fnatic (0.68) and mousesports (0.67) do not fare much better. Unlike FlyQuest however, these four teams find themselves at/near the bottom in terms of chances created.
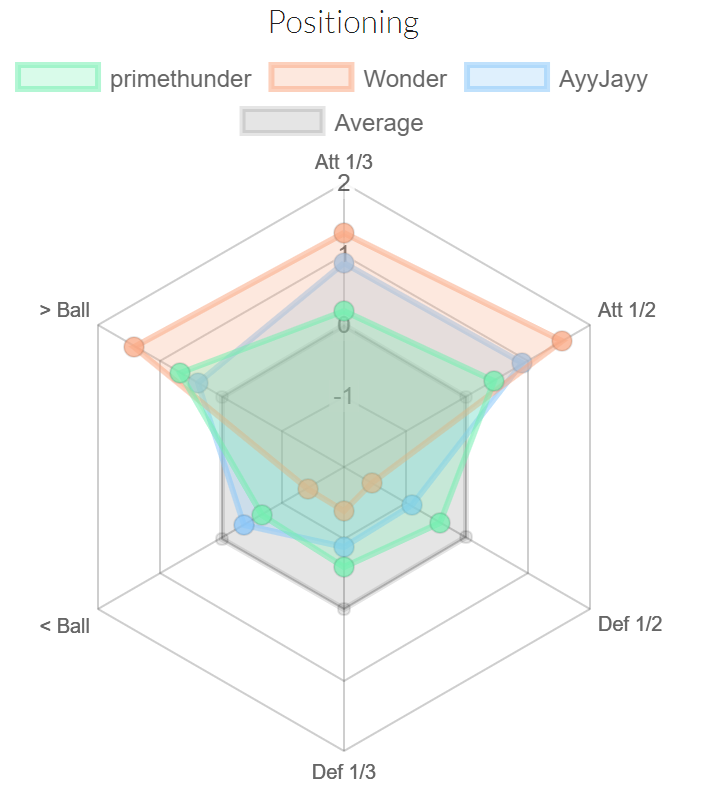
FlyQuest’s one-of-a-kind 3 man forward formation. See here to compare these stats and others between teams.
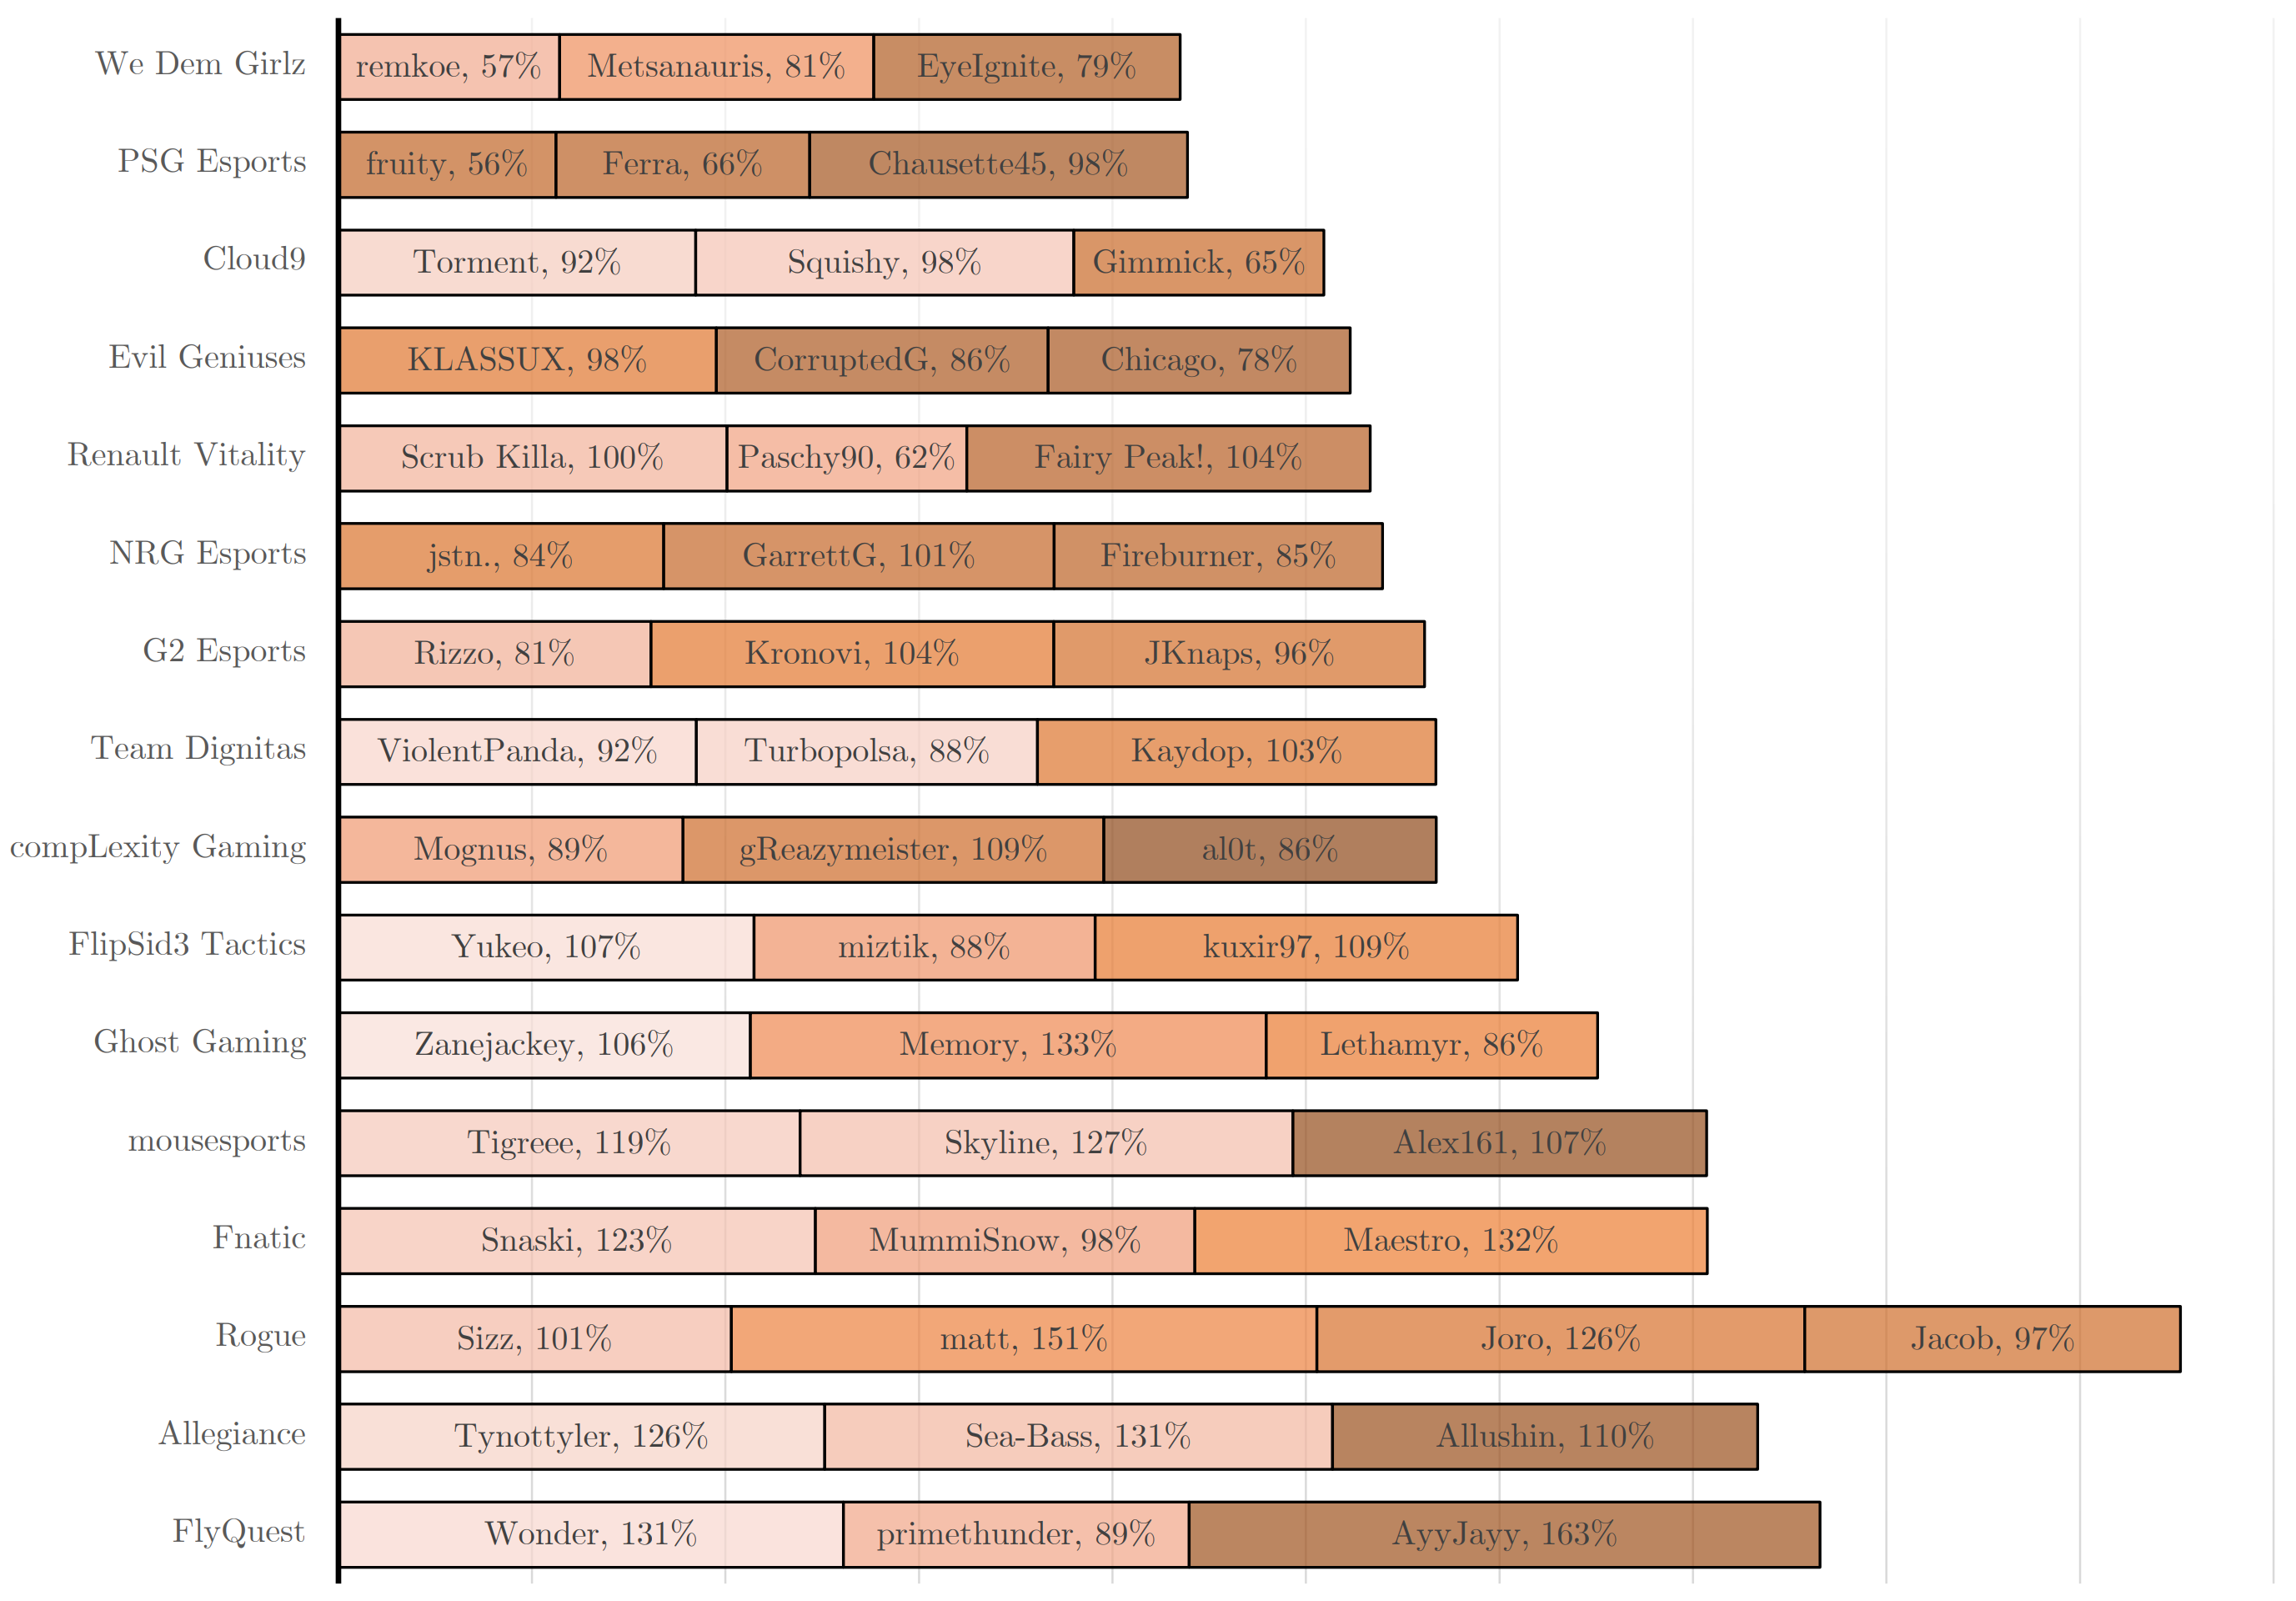
Usage Imbalance: variance in xG/xGa per game. Another interesting thing to note is the variance in xG (or xGa) per game within a team. This is a measure of the imbalance in the way a team sets up to play. On one extreme, F3 finds themselves with a standard deviation of 0.28 in their xG per game, with kuxir97 taking 55% of his team’s chances. C9 (0.21) is the runner-up in this contest of imbalance, with Squishy and Gimmick taking 42% and 38% of the team’s chances, leaving Torment with a mere 21%1. In the battle of equality, EG (0.02) come out on top, with the chances being split 32%, 34%, and 35%. Allegiance (0.04) and Vitality (0.04) come close with a split of [31%, 33%, 36%] and [31%, 32%, 37%] respectively.
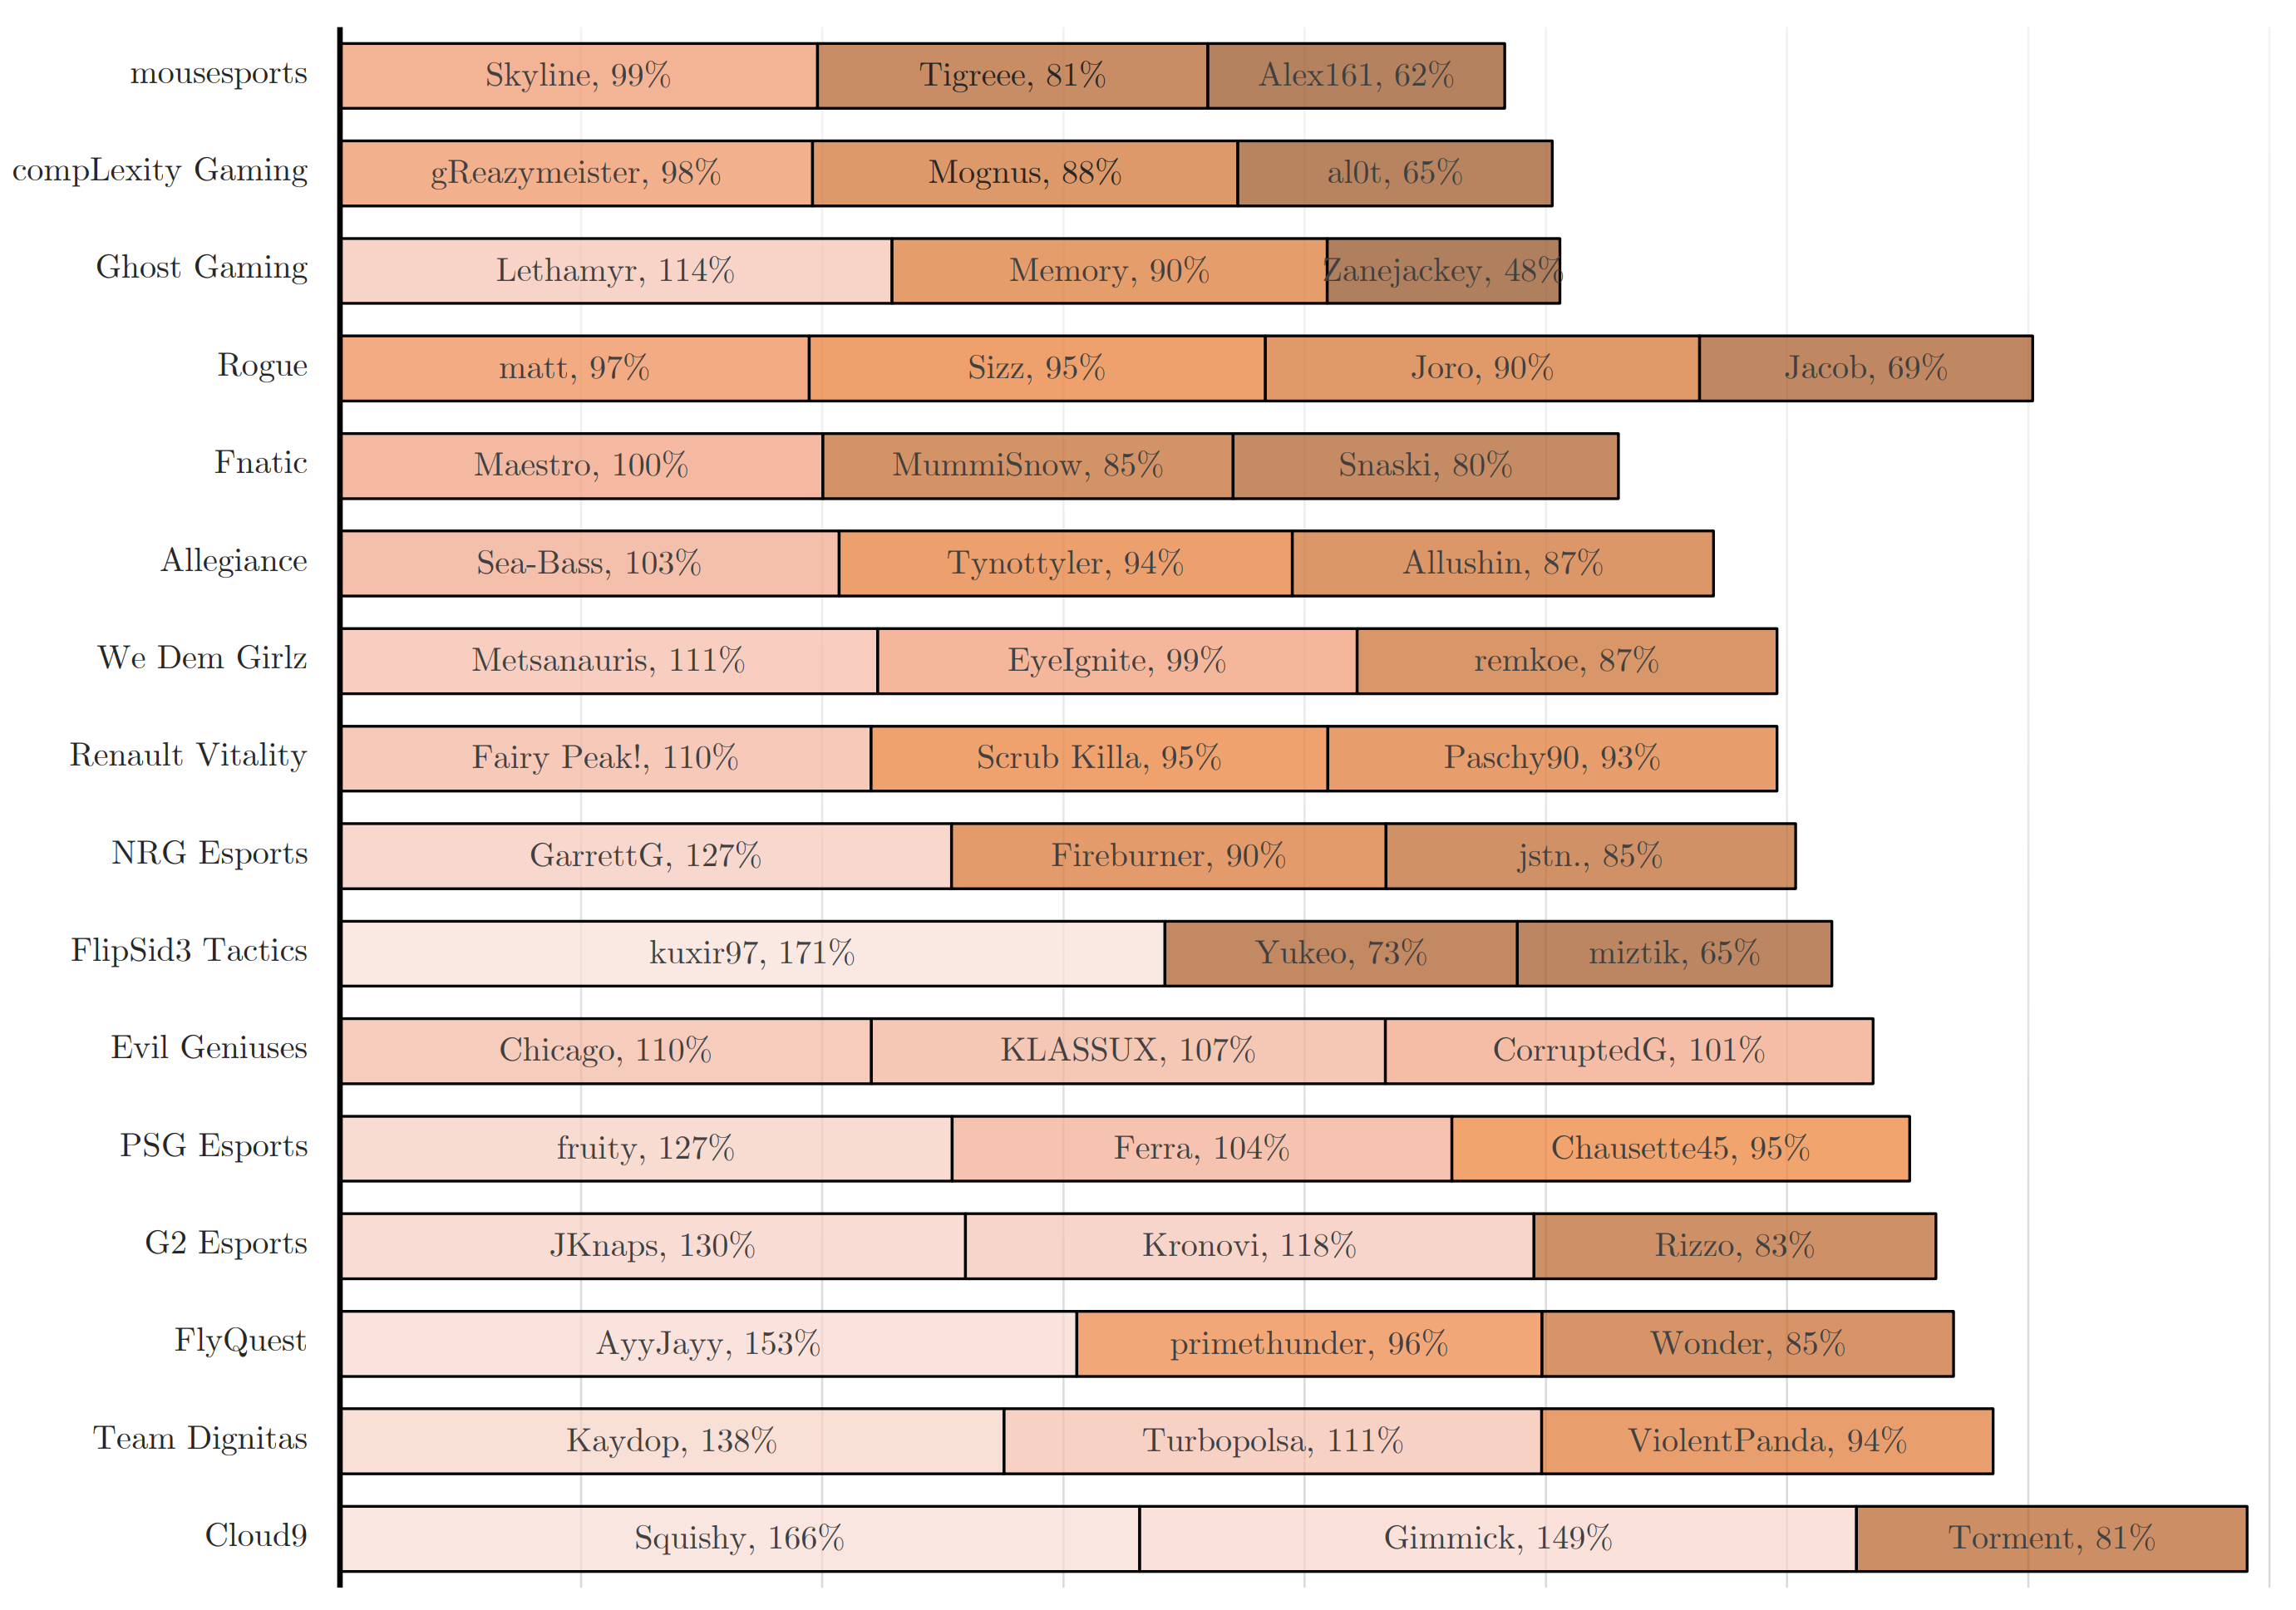
On the defensive end, FlyQuest run away with their imbalance, with a standard deviation of 0.21 in their xGa per game. Facing 89% the average xGa per game, primethunder gives AyyJayy the honour of defending against 163% the average xGa per game (while Wonder goes against 131% the average xGa per game). Dignitas (std. dev. of 0.04) take the other route and share defensive duties extremely equally. Kaydop handles 103% the average xGa per game, while ViolentPanda faces 92% the average, and Turbopolsa roughly equals primethunder’s defensive contributions with 88%. The main difference here is that his two teammates do not share a ridiculous burden.
Players
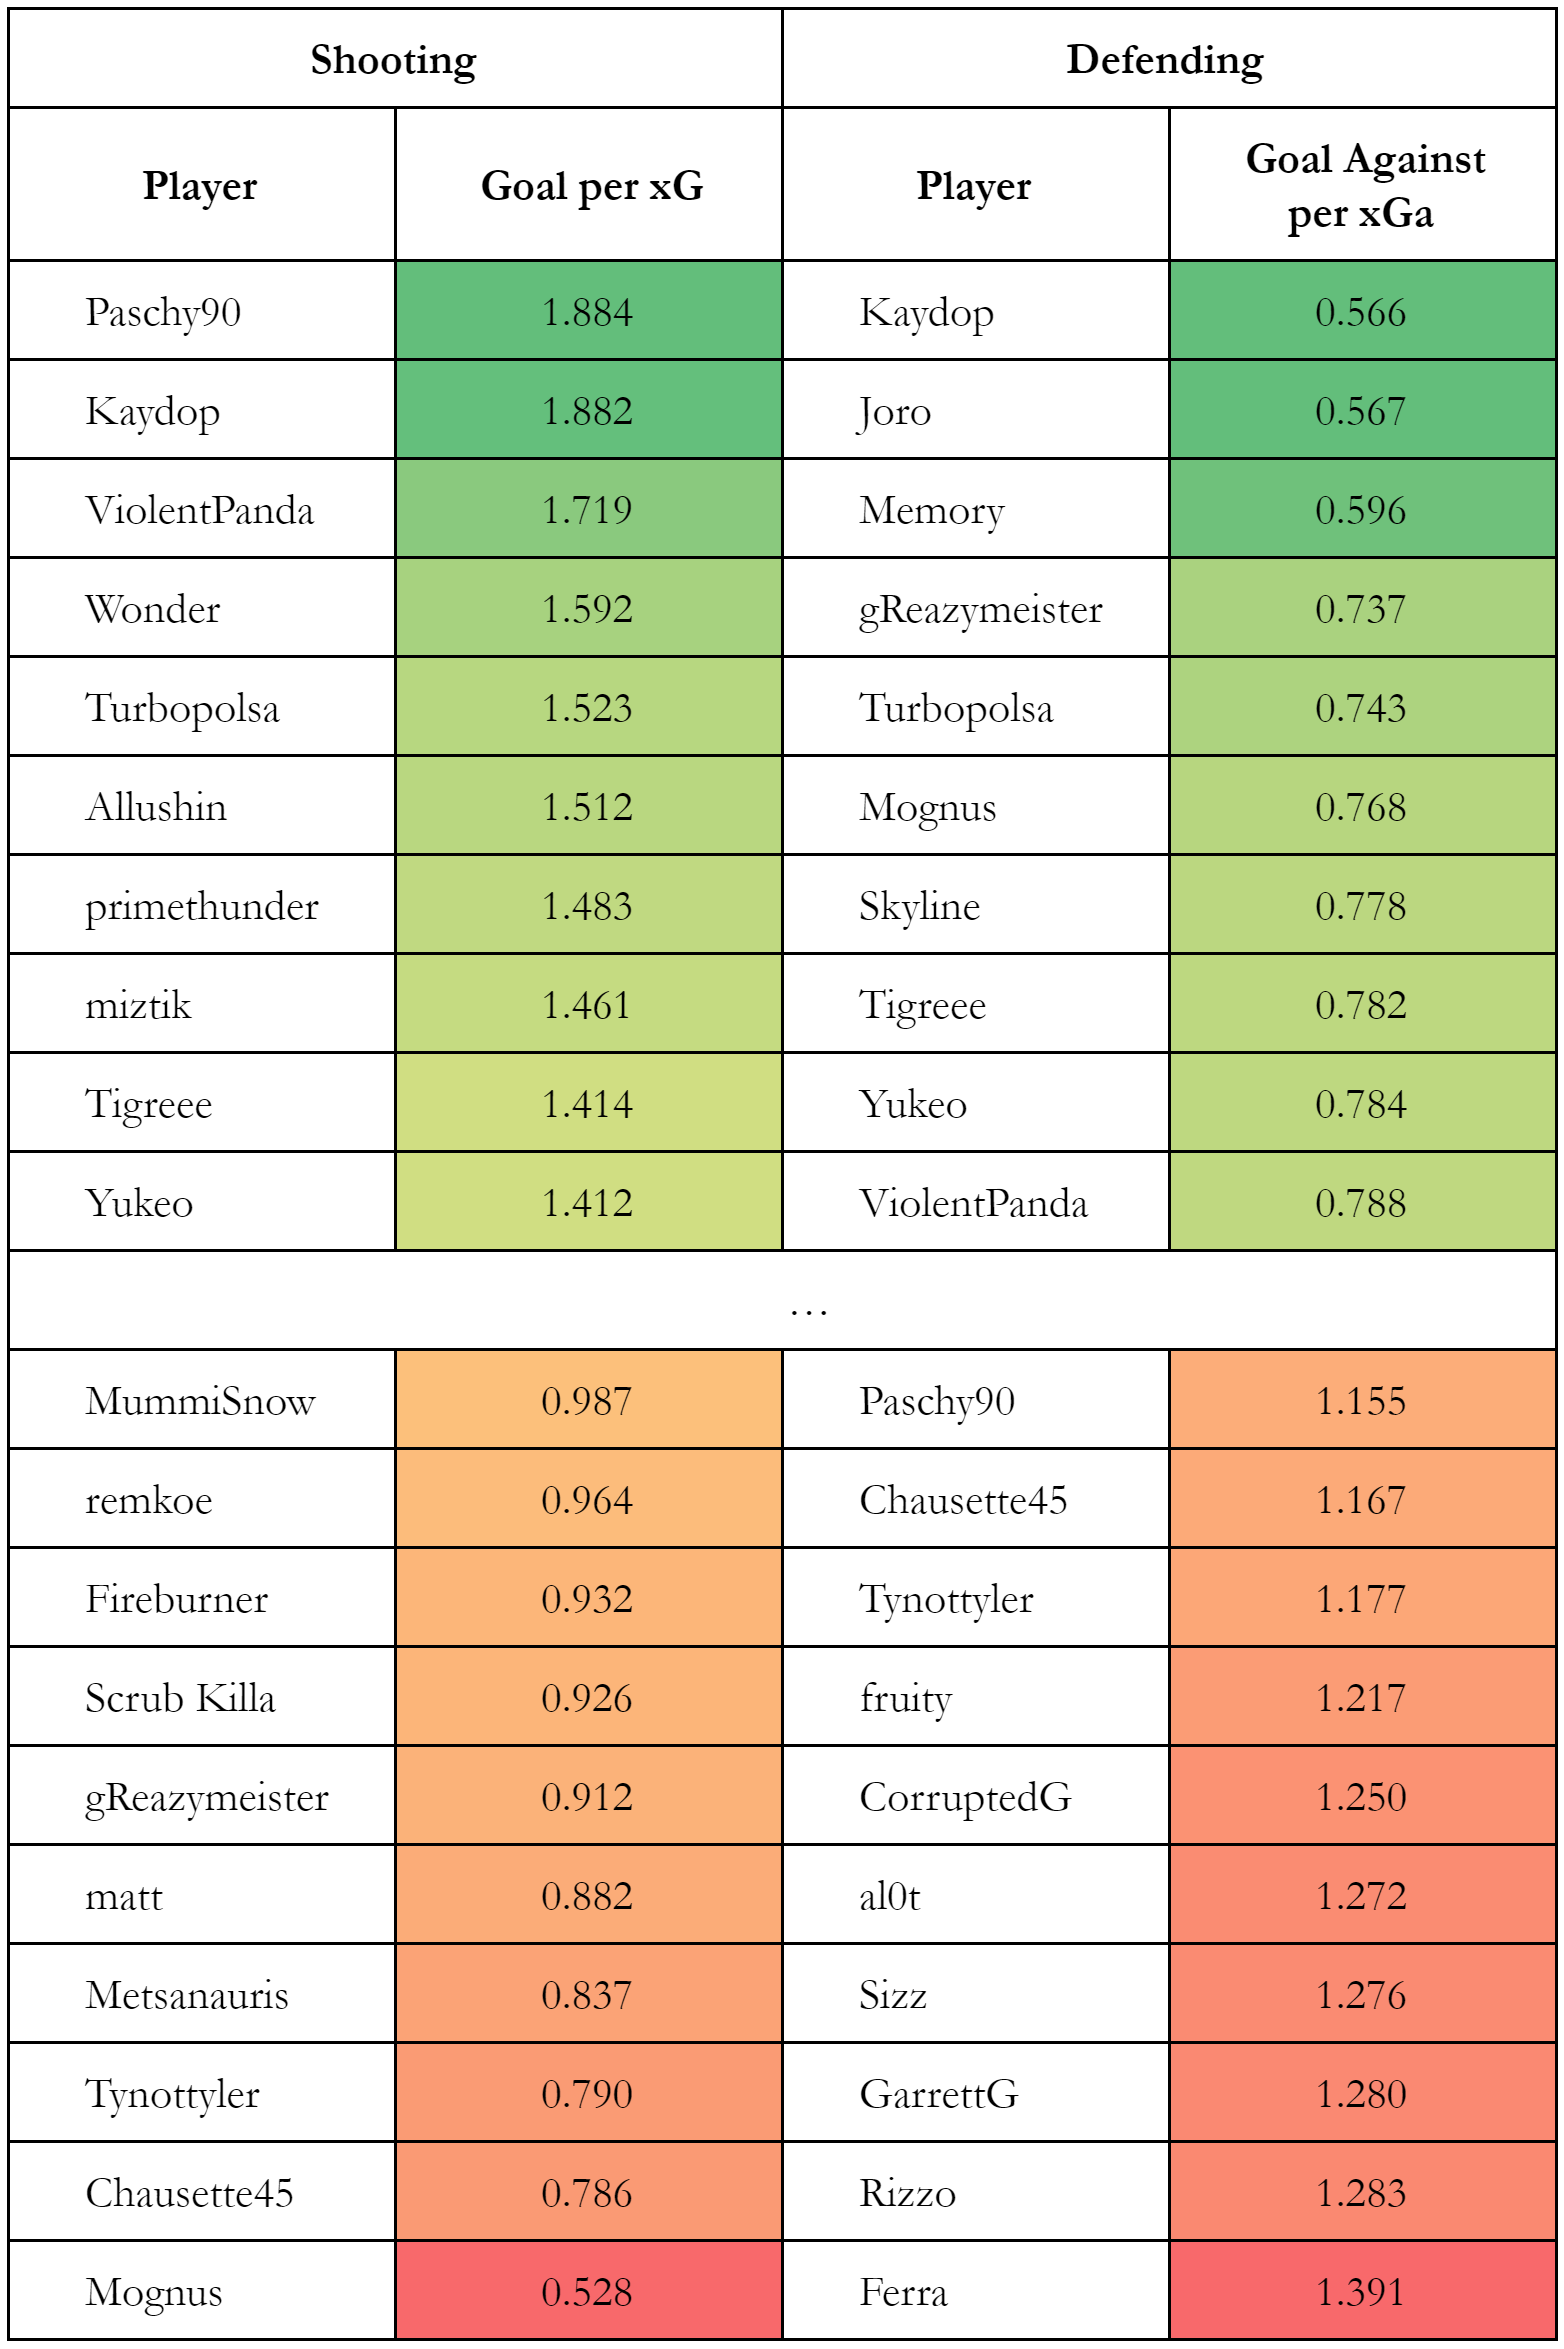
The best and worst goal-scorers and goalkeepers are shown in the table below (or in the fuller sheet here). Dignitas are individually all god-like, while the WonderThunder and Yukeo-miztik duos also make appearances.
In defence, the top 3 shot-defenders are Kaydop (0.57 goals conceded per xGa), Joro (0.57), and Memory (0.60). At the other extreme, Ferra (1.39), Rizzo (1.28), GarrettG (1.28), Sizz (1.28), and al0t (1.27) came up short when faced with shots.
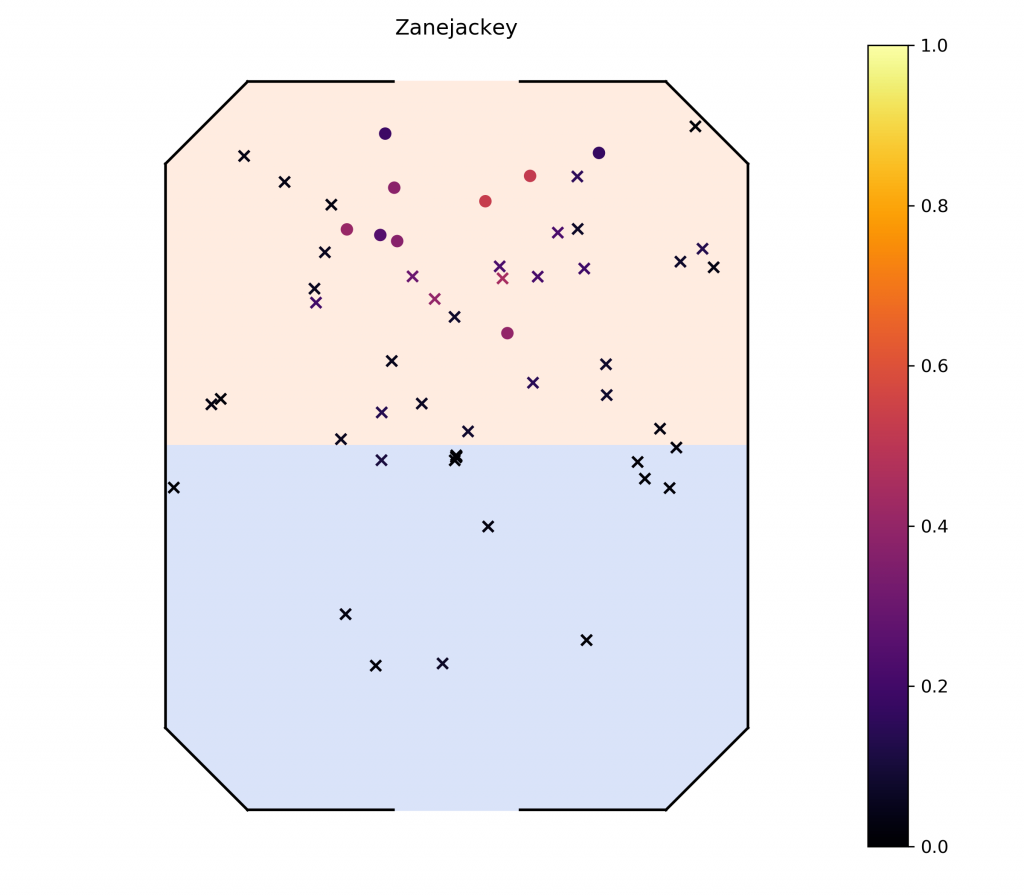
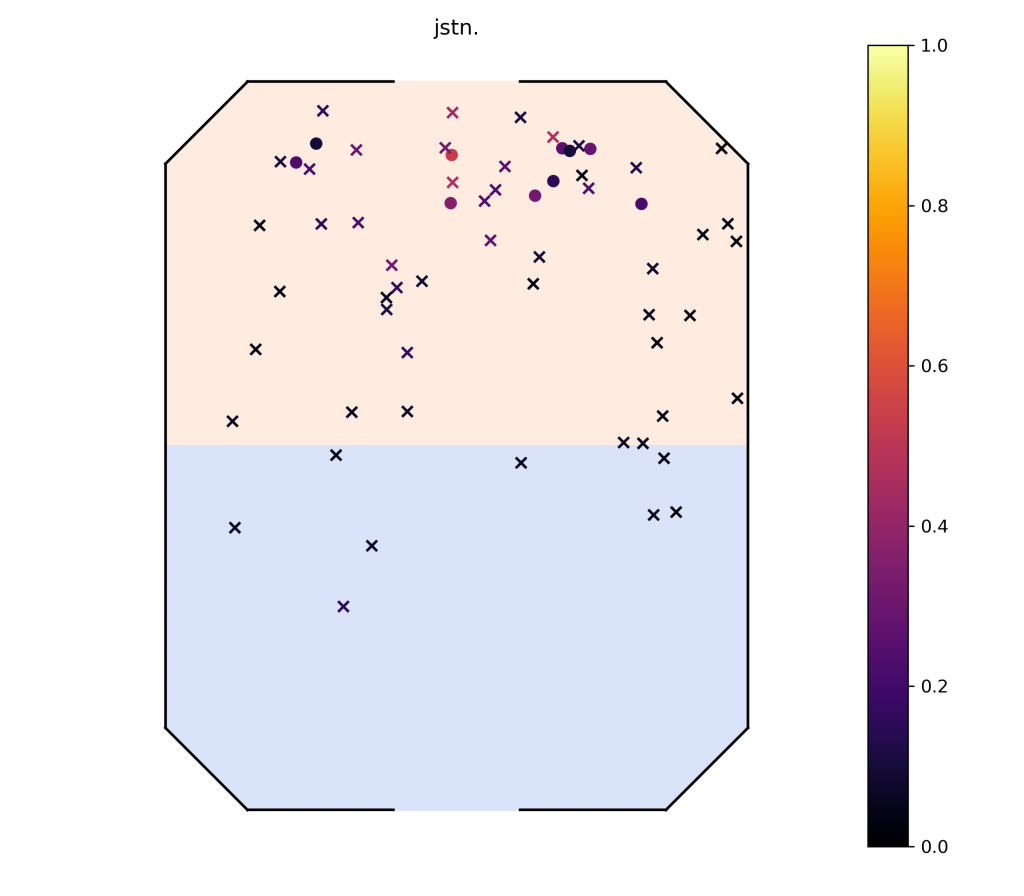
Shot selection: average xG per shot. CorruptedG takes the easiest shots on average with an average xG per shot of 0.244, while Zanejackey (0.153) and jstn. (0.149) take the most difficult shots on average. Zanejackey’s extreme numbers are likely due to how little he is involved in the offence (as can be seen by the dearth of shots directly around the goal in his shot chart below), while jstn.’s numbers more likely reflect the pressure he seeks to put on the opponent’s net, and his belief in his ability to make things happen. Take note that for these stats, only shots with an xG of >0.01 were considered. This excludes most of the dark ×’s in the shot charts, especially those at kickoff2.
Offensive Usage: xG per game. In terms of offensive chances per match, kuxir97 comes out on top with 0.80 xG per game. Squishy comes in second with 0.77. However, while kuxir97’s teammates sit near the bottom with 0.34 (Yukeo, 6th from the bottom) and 0.30 xG per game (miztik, 4th from the bottom), Squishy’s teammates sit at 0.69 (Gimmick, 4th) and 0.38 xG per game (Torment, 9th from the bottom). Rounding off the top-5 shot-takers are AyyJayy (3rd, 0.71) and Kaydop (5th, 0.64). On the other side, Zanejackey (0.23), Alex161 (0.29), al0t (0.30), miztik, and Jacob (0.32) round out the list of players struggling to pressure their opponents’ net.
Offence-suppression (difficulty): average xGa per defence. With low average xGa per defence, remkoe (0.12), fruity (0.13), Paschy90 (0.14) and Gimmick (0.14) generally faced easier shots than their peers, while Allushin (0.24), TyNotTyler (0.23), AyyJayy (0.23), Sea-Bass (0.22), Zanejackey (0.22), and all of Fnatic (Snaski 0.22, MummiSnow 0.22, Maestro 0.21) faced harder-to-defend chances.
Defensive Usage: xG per game. Defending few high-quality chances per game, fruity (0.32 xGa per game), remkoe (0.33), Paschy90 (0.35), Gimmick (0.37), and Ferra (0.38) are on defence less than AyyJayy (0.93) and matt (0.87). EyeIgnite and Metsanauris are both also in the top-10 lowest xGa per game.
These last two stats are likely affected by the way the teams and players set up in defence. In particular, WDG’s bimbam playstyle is effective in preventing opponents from creating good chances. In fact, the stat show that the incredible speed of WDG and C9 actually mean that they not only limit the opponents to hard shots, they also limit the total value of chances their opponents have. Naturally, care must be taken when trying to further interpret the data. There is no doubt correlation between all these stats, with things like boost control, mechanics – unpredictability and consistency (to pull off whatever comes to mind) at speed likely being the root cause of these stats.
Model bias
The above table suggests that there might be biased toward the clean-up crew who poach goals after initial shots are taken. Notably, Paschy90 is top of this list, while miztik and Yukeo are both in the top 10. While the latter two are undoubtedly good players, that both of them appear high up in this list while kuxir97 is taking the large majority of his team’s shots indicates that this model might favour the follow-up shot-takers. This might be the case if the model fails to reliably detect when the defence is wrong-footed. However, I would expect that this sort of bias would result in a goals per xG correlation with average xG per shot, where the model is able to detect easier shots but is not too sure about it. Furthermore, I might expect a negative correlation between goals per xG and xG per game, where most first-choice shot-takers will have a low goals per xG. However, neither of these correlations can be seen. The first pair of stats has a correlation of 0.05 while the second has a correlation of 0.073.
To me, this table passes the eye-test beyond the possible bias discussed above. I do welcome more input as to the reliability of this table and where possible biases might lie.
At this point I’m not sure if Mognus is being represented unfairly due to us missing out on 4 of his goals in our data. If he wishes to defend himself, I do hope he finds more success doing so than he did in finding the back of the net this past season.
Conclusions
The calculated4 stats were delved into detail here. I have described most of the extremes, and this does pass the eye-test. The stats do a good job of breaking down the various play-styles of teams and players, and this model paves the way for future analysis to take it further.
This analysis can lead directly into machine learning fairness analysis. Beyond the possible hidden bias discussed above, a more prominent bias can be seen in the way the baseline xG is not exactly 1. Here, accounting for different levels of play-style was done superficially (by retraining without sample weights), meaning this model will not perform well when applied to anything else (e.g. likely unreliable for all standard ranked 3’s, and completely useless for anything sub-Champ). A more general solution would be useful, perhaps one that involves using an LSTM on an extended window of frames to allow it to gauge player-skill levels.
Next time on “Expected Goals in Rocket League”: what do these stats mean, how can we learn anything from them, and what makes a winner… Tune in tomorrow night for the series finale.
Once again, here is our Discord server where you can get answers to any questions you might have!
EDIT: Part III can be found here!
TL;DR
- All three of Dignitas count themselves among the top shooters and defenders. As a team, they managed to create the second most chances per match, second only to C9.
- C9 are also one of the most imbalanced teams when it comes to each player’s share of attacking chances, with Torment being left out. In offensive imbalance, they come second to F3, who have a heavily kuxir97-led attack.
- Zanejackey and jstn. take the most difficult shots on average, although this is undoubtedly for very different reasons.
- This table of the best and worst shooters and goalkeepers according to the model.
- The model shows signs that suggest it might be biased to favour goal-poachers, but this has to be further investigated before conclusions can be drawn.
- Part III looks into what characterises winning teams.
Expected goals will return.
Footnotes:
- Error in the total sum is due to rounding.
- The dense gathering of ×’s right below the centre of the pitch in the shot charts are kickoffs where the player hits the ball towards the opponent’s net. I make the (I think safe) assumption that these are of extremely low xG as they will all have an easily-detected player directly opposite contesting. You can check this yourself by setting the xG threshold to 0.01 here.
- N.B. This latter correlation is in the “wrong” direction, and the magnitude of both values represent a negligible correlation.
- .gg
