
Previously…
Part I was the origin story for the expected goals (xG) model, while Part II covered the stats in detail.
Makings of a Winner
Here, we will take a look at what characterises a winning team and draw some conclusions about where Rocket League. This article will make references to stats which can be found here.
Looking at Dignitas
Having a team named Dignitas means you have a 66.6% chance of winning RLCS. Being Turbopolsa means you win 50% of all RLCS’s1.
What separates Dignitas from the pack is their great individual shooting and goalkeeping ability. Dignitas went on a 7-0 streak, dropping very few games. Their striking was on point, although led by Kaydop, both Turbopolsa and ViolentPanda can count themselves among the top shooters in the world. Not wanting for any offensive or defensive skill, Dignitas managed to do with a bang-average xGa per game.
However, simply going off (goals per xG − goals conceded per xGa) does not provide a good measure of a team’s abilities. Whether you do that based on the exact numbers (which puts PSG, compLexity, NRG, and WDG on the bottom while Ghost is 3rd), or based on the normalised numbers where standard deviations of the two stats are both set to 1 (which puts EG second-last and Rogue 6th, above NRG and G2), neither of these combinations look great.
In fact, taking the team-average of any individual one of the six main stats yields no strong correlation with team-placing.
A 2-stat Combination
A closer look reveals that sorting by average xGa per defence yielded a order that underestimated Dignitas, F3, and FlyQuest in particular — all teams with a high goals per xG (representing good shooting). Combining the two stats of average xGa per defence and goals per xG correcting for scales (roughly) yields the following ranking:
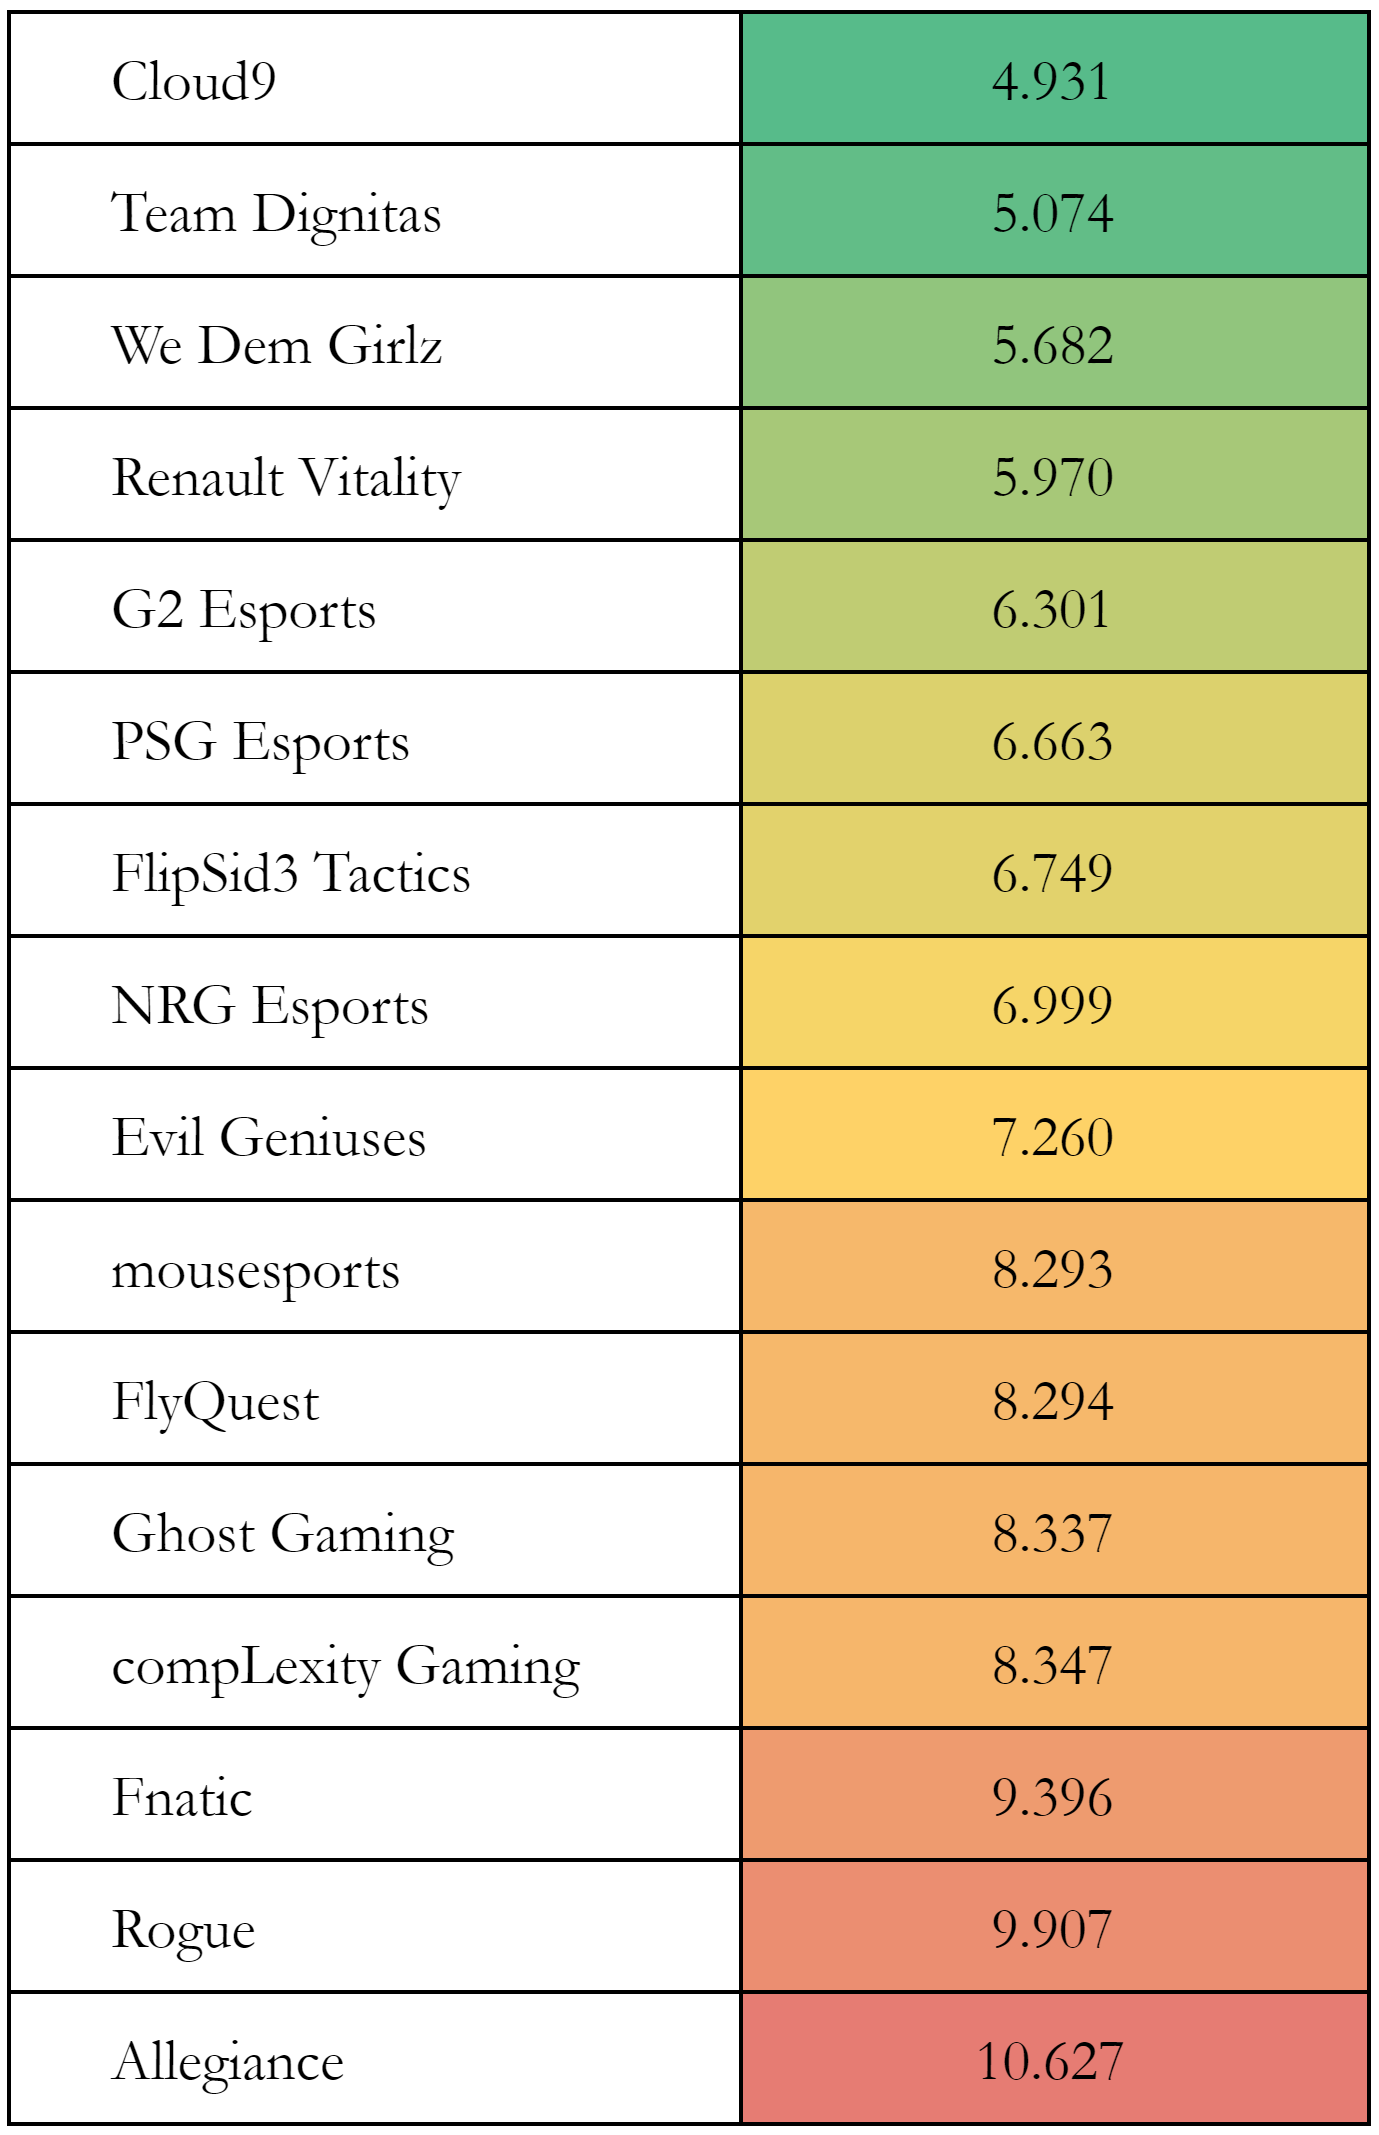
average xGa per defence and goals per xG .
N.B. This table does not show that we could predict C9 winning RLCS2.
Tiers can literally be seen! The stats from both regions are similar (and can be comparable keeping some limitations in mind). The world-beating powerhouses of C9 and Dignitas lead the table, while at the other end, Allegiance, Fnatic, and Rogue are labelled with a resounding red.
A Peek at ELEAGUE
I have calculated the same stats for ELEAGUE and generated a similar table:
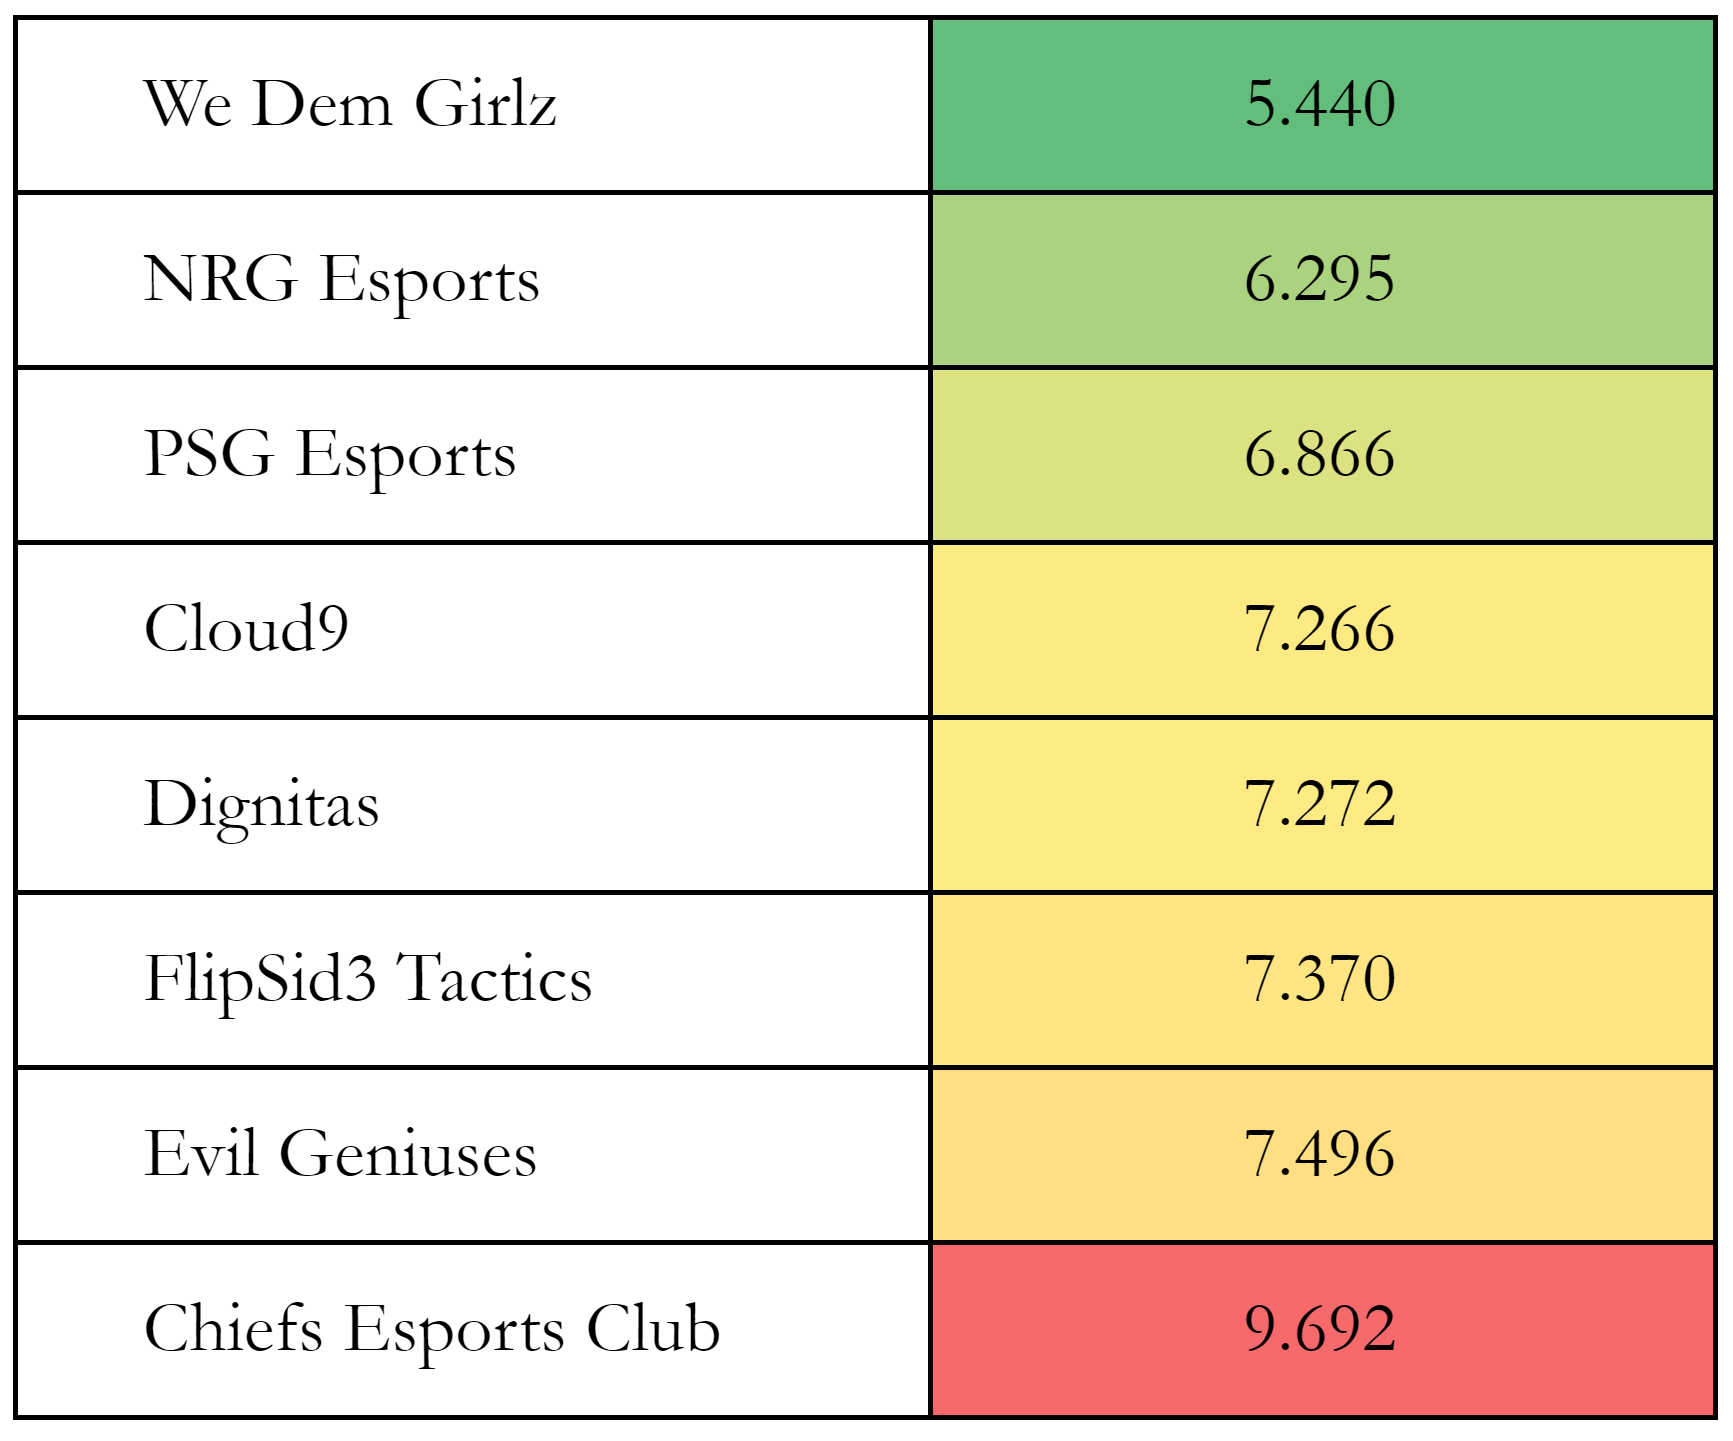
In case you have forgotten what the results looked liked, WDG won, beating C9 4-1 in the finals. C9 beat Dignitas 4-1, and WDG beat NRG 4-2 in the semi-finals. In the earlier stages, WDG lost to F3 before beating them in the loser’s bracket, F3 fell to Dignitas, PSG lost 3-4 to C9 and then 0-4 to Chiefs, and NRG defeated C9 4-2. Apart from a couple results (namely WDG losing to F33 and PSG losing to Chiefs), this ranking follows the order as expected from the match results.
There is one exception: PSG. They lost to C9 3-4 then fell to Chiefs 0-4. However, I think their high rating can be put down to a small sample size, a problem also shared by both EG and Chiefs. However, PSG’s high ranking here might be a result of playing well in their games, but just not getting the game-wins to reflect it. Also, the 3rd to 7th teams are extremely closely-rated, with a range of just 0.7. This exacerbates the low-sample-size problem.
Interpretation
Keeping in that in mind, this analysis shows that these two stats are sufficient in predicting team results. Now comes the extremely tricky part where we have to come to conclusions!
Of the two stats used to generate this table, one is an offensive one while the other is a defensive one. Neither can tell the full story of a match — goals per xG leaves out the number of chances the team manages to generate, while average xGa per defence leaves out how well individual players actually perform when defending these shots, as well as how many chances they tend to give up. However, the fact remains that one can extrapolate team performance from just these two. This suggests that the information left out does not significantly affect the teams’ results.
It seems that good teams can count on getting chances (leaving out xG per game), and it does not matter what kind of chances they are creating so long as they are shooting well. On the other side, individual defence (goals against per xGa) seems to matter little in the grand scheme of things, with team-defence (making opponents take hard shots) being particularly important. Great teams are good at both, and in addition to that, Dignitas shot incredibly, while C9 limited their opponents to difficult shots. Good teams tend to be separated by their team-defence, while teams that fared badly during League Play generally tended to give up easier shots.
Applying to Players
Now, can these two stats be combined in the same way to look at players? It certainly seems so. After all, these team-stats were just averages over the player stats.
This players in this chart form a really nice diamond. Where bottom-right (with the default axes of xGa per defence against goals per xG) is good, most players on the first two lines seem to pass the eye-test. All of Dignitas and C9 find themselves near that corner.
Paschy90? He is an indisputable GOAT of course4.
Conclusion
Here, I have looked at how the six main stats contribute to team performance. Shooting proficiency (goals per xG) and opponent-chance-suppression (xGa per defence) have been identified as two significant indicators.
While it is hard to pinpoint any specific recommendations with the limited stats considered here, this does suggest that these two stats in particular warrant further looking into.
Final words (of the series)
This analysis hopes to open the gates for more advanced metrics to be applied in Rocket League. Only a basic “throw-stuff-at-a-NN” method was used, and this was evaluated and found to be relatively successful. There is still much room to improve in this area, as the trained NN had an F-score of around 0.3 after being trained.
Beyond this simple implementation of expected goals, generating expected values across a whole possession will improve analysis. Expected goals as a stat works well in football due to shots being the final aim of almost all play. However, in Rocket League, shots tend to be built up over more significant periods of time, where both teams have the chance to repeatedly challenge for the ball, and make multiple plays. Generating expected values across all hits will enable the model to give value to (and thus enable analysis of) all plays.
Looking at advanced stats beyond expected goals, usage percentages and other forms of efficiencies will be useful in analysis. While this analysis touched on measuring usage, no strong correlations were found (whereas one might expect efficiency (xG) goes down as usage goes up). Reasons for this should be further investigated.
Having been looking through replay data in Rocket League for three years now, I have found my way from a Python beginner to being all-too-familiar with pandas. I hope others can use this opportunity to do the same. We have good data, all my (and some others’ work) are open-source and can be found on Github.
Once again, come join our calculated.gg Discord server for discussions and future updates!
TL;DR
- Dignitas excel on an individual level, but do not significantly limit opponents’ chances.
- Most good teams suppress the quality of opponents’ chances, while the best teams have great chance-conversion.
- The two stats of goals per xG and average xGa per defence identify team success very well.
- On a player-level, these stats seem to correctly identify great players.
- Paschy90 is a world-beating GOAT.
Footnotes:
- #stats
- The two regions do not interact in the games used to generate these stats (League Play), and C9 faced opponents who are generally lower-rated here.
- Entirely unavoidable as there is a non-transitive loop of WDG losing to F3 who lost to Dignitas who lost to WDG. Also, WDG did beat F3 in their second match-up.
- I honestly do not know how he manages to game this stat so badly. He resembles Stephen Curry on basketball shooting charts or Messi/Ronaldo on football goalscoring charts… It’s incredible.