
Expected goals: An introduction
What is an expected goal?
Expected goals (xG) is a stat (commonly used in football and hockey) that quantifies the quality of a scoring opportunity (a chance). For every shot in every game, the probability of that shot becoming a goal is predicted. In the simplest of models, this is usually based on the distance to the goal. Intuitively, the further you are from the goal, the less likely your shot will be a goal.
Quantifying the quality of scoring opportunities is a pathway to many analyses I consider to be crucial. Consider a situation where you and your solo standard teammates all take 5 shots, scoring no goals. You point out that your shots were flip reset double touches musty flicks where you just failed to beat the last defender, whereas theirs were open-goal misses. The end-game scoreboard stats sadly misrepresent the situation and fail to reflect that it was your teammates’ failed shooting that cost you the game1. Here’s where expected goal (xG) stats come into play! You can point at your low xG, which reflects the quality of the chances you had – it was to be expected that you would not manage to convert them. Their xG, on the other hand, will show that they were on the receiving end of significantly more/better chances and should have scored more.
Over a large number of games, players’ goals per xG will represent their ability to convert chances, and their average xG per shot will indicate the difficulty of shots they’re taking. Also, players’ average xG per game represents the scoring chances they get (and when comparing between teammates, this number can show their respective usage percentages on the offensive end of the field).
Modelling with Neural Networks
Input, Output, and Structure
If you know nothing about neural networks, I suggest you skip this subsection, just noting that the model was fed a frame of data containing information about the players and the ball, and it was asked to output a number from 0 to 1. Alternatively, read through it and ignore whatever you do not understand. It is not crucial.
A neural network was fed the position and velocity of all players and the ball, as well as the time remaining in the game a couple frames before the shot was taken (about 0.1 to 0.2s before the hit happens). The network has a single node in the output layer with a sigmoid activation function to yield valid probabilities.
The network consisted of a convolutional layer followed by densely connected layers2. The convolutional layer had a kernel size of 3, and was introduced to simulate vector dot products to allow the model to better deal with the geometric nature of the coordinate inputs (position and velocity being X, Y, Z; rotation being pitch, yaw, roll).
Training
The bulk of the training data was sourced from calculated.gg’s high-MMR (>1500: GC) standard 3’s replays. Each shot was weighted as 1 / (count of that category), for goals and non-goals. This was done to work around the extremely imbalanced categories; there were many more shots that were not goals compared to shots that were goals. Giving each category equal total weight helps the model to learn beyond trivially categorising everything as “not a goal” and still having a high accuracy. However, this leads to an overestimated xG.
To calibrate the model so that the average of goals per xG ≈ 1, the model was retrained without the custom weighting applied. This retraining was done on data from DH Leipzig ‘19. Only the last two (dense) layers were trainable during this retraining (i.e. only weights of the last two layers were modified), and the Adam optimiser was used with a low (0.00001) learning rate.
Results and Analysis
Visualising xG values
Expected goal stats were calculated for all shots in all RLCS S6 League Play games for EU and NA. These are shown in the album: https://imgur.com/a/iegdnoi, or in 3D:
http://blog.calculated.gg/files/xG.html.
Shot-detection is done using our custom shot detection (which involves simulating the ball’s movement a couple of seconds and seeing if it will enter the goal if unimpeded by any car).
As can be seen in the album, the NN model performs beyond a “distance to goal” analysis, correctly predicting some long-shot goals and near-net misses. The model likely calculates and takes into account things like defender positioning, where the closest defenders to both the ball and the goal can affect the difficulty of the chance.
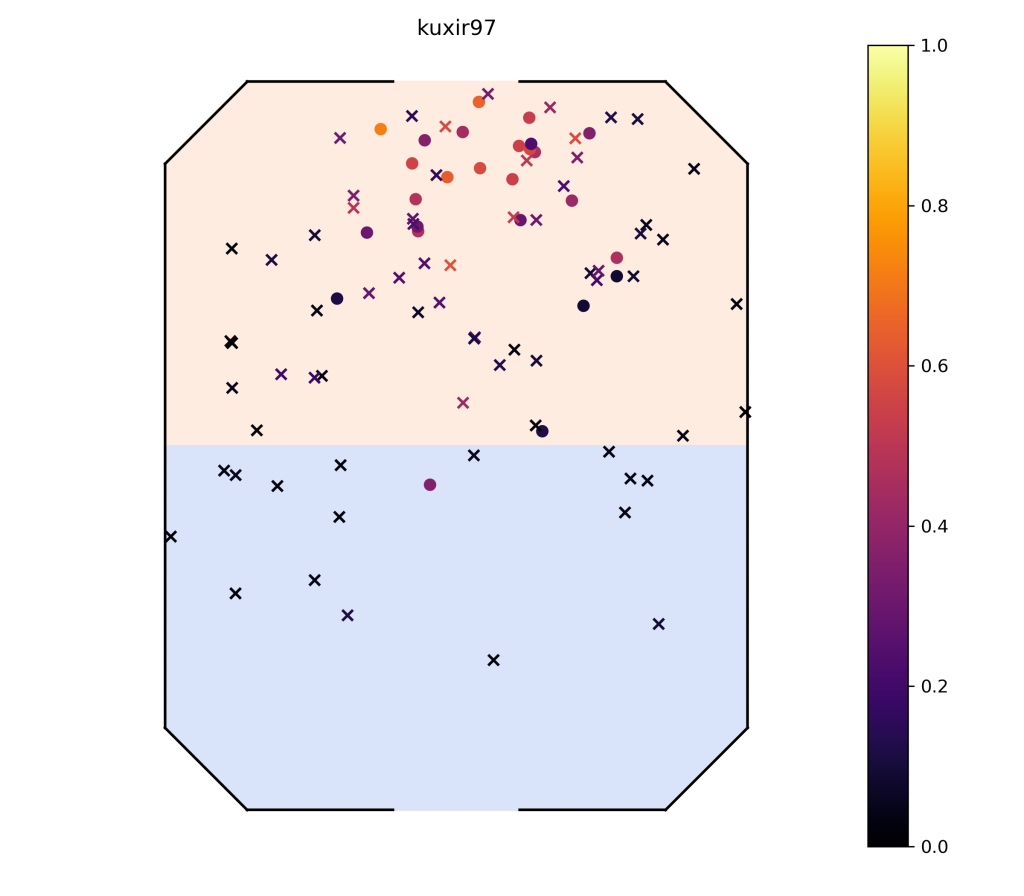
Predicted xGs for kuxir97. Dots represent goals while crosses represent shots that are not goals. Note the model’s ability to spot shots that might be easier than expected if only distance-to-goal is taken into account.
Stats
Various xG stats are calculated for each player and can be found in full here. In particular, look at the “Team/Region Pivot Table” and “Player Table” sheets, which can be sorted by the various columns (though not on mobile). The “Stat Explanations” sheet also contain more in-depth explanations for the main stats, and how they can be interpreted/analysed.
Of note is that the baseline xG was not incredibly precise, with players averaging 1.2 goals per xG. As the baseline training was done on (the extremely-stacked) DH Leipzig ‘19 replays, these extremely-high level training data results in a model that overestimates defences when applied on RLCS League Play games3.
Conclusion
Here, I have introduced the idea of expected goals and how I have made a non-trivial (but not extremely fine-tuned) implementation to model and predict it. The full results are linked above, but as they are very densely packed with information, another article will come (tomorrow) diving deeper into them.
EDIT: Part II can be found here.
In the meantime, do join our Discord server here and come discuss some stats!
TL;DR
- Expected goals (xG) is an advanced stat that measures the quality of a shooting opportunity. For each shot, a number from 0 to 1 is calculated representing the probability the shot will be a goal.
- A neural network was trained on high-MMR ranked 3’s using calculated.gg’s database, and re-trained on Dreamhack Leipzig ‘19 replays to recalibrate to RLCS-level baselines.
- The model was used to analyse RLCS S6 gameplay.
- The model visibly performs beyond a simple distance-to-goal calculation.
- Calculated stats can be found:
- 2D shot charts: https://imgur.com/a/iegdnoi
- 3D interactive shot chart: http://blog.calculated.gg/files/xG.html
- Spreadsheet: https://docs.google.com/spreadsheets/d/e/2PACX-1vTKx7TQRj67P6tSb21lIAMx3x7qAxQzZUdV3UZld6aIsvhynbY8jIzUj7e5dTfZpoMKXxeR4jFXXxm3/pubhtml#
- Look out for an in-depth look into the stats in Part II.
Expected goals will return.
Footnotes:
- Totally not the fact that you were pre-jumping for cross-field passes and wasting possessions going for low-yield plays.
Keras’s model.summary() (N.B. 21 = 61 / 3 + padding of “same”):
 _________________________________________________________________
Layer (type)                 Output Shape              Param #
=================================================================
reshape (Reshape)            (None, 61, 1)             0
_________________________________________________________________
conv1d (Conv1D)              (None, 21, 1024)          4096
_________________________________________________________________
flatten (Flatten)            (None, 21504)             0
_________________________________________________________________
dense (Dense)                (None, 512)               11010560
_________________________________________________________________
dense_1 (Dense)              (None, 128)               65664
_________________________________________________________________
dense_2 (Dense)              (None, 1)                 129
=================================================================
Total params: 11,080,449
Trainable params: 65,793- There is an observable trend of higher-level teams becoming more capable in defence relative to the improvement in shot-taking. An initial model trained on high-MMR ranked 3’s only yielded an average goals per xG of 0.6 when applied on RLCS League Play games, likely reflecting the focus on good rotation and defensive skill RLCS teams have compared to high-MMR teams.