Evaluating Rocket League Gameplay From First Principles
Rocket League gameplay is complicated. From the subtle reasons behind every action to the intricate details you have to consider when analysing movements, analysis is not easy. When tackling this problem before, I’ve chosen to look at a very narrow slice of gameplay; expected goals only considers shots and goals. While this made results easier to interpret, the results were not a reflection of full gameplay. Can we evaluate all aspects of gameplay? How?
One way is to carefully break down gameplay into the parts that make it up, individually analyse and evaluate these separate aspects, then come to the conclusion that
Tecko is fantastic, it just needs to work on positioning, boost management, clears, passing, dribbling, flicks, saves, rotations, aerials, fake challenges, aerial dribbles, corner reads, boost steals, flip resets, mind-games, 50/50s, demos, double touches, ball control, speedflips, boost starving, pinches, re-directs, and dunks.
Needless to say, that’s not possible where Rocket League analysis is at the moment.
Instead, I propose a novel never-before-seen method: Throw it at a machine learning model and see what happens.
You score goals — good; opponents score goals — bad
Let’s start. Follow me carefully. Ensure you understand before moving on. Things get complicated.
How do you do well at Rocket League? By winning games. How do you win games? By scoring more goals than your opponents. How do you score more goals than your opponents? By scoring goals and preventing your opponents from scoring goals.
If you’ve followed me so far, you’ve done it 🎉 you’ve cracked the code. You score goals — good; opponents score goals — bad.
Let’s try formalising it (or at least making it less meme-y).
Given a specific situation on the pitch, if your team has an advantage, that means that your team is more likely to score the next goal. A disadvantage is the opposite: the opponents are more likely to score the next goal.
Anything that increases your team’s chance to score the next goal and reduces your opponent’s chance to score the next goal is a good thing.
Calculating a player’s contribution
To calculate how much a player contributes to their team’s chances of scoring the next goal, here’s what we can do:
- First we train a machine learning model to predict which team is going to score the next goal, given what’s going on on the pitch: player car positions, velocities, ball position, etc.
- That is, given a pitch situation s, the model returns the probability between 0 and 1 that the orange team scores the next goal, P(\text{Orange}|s) = 1 - P(\text{Blue}|s). (Inversely the probability that the blue team scores the next goal is 1 minus this value.)
- Then we take a new situation on the pitch, let’s call it s, and ask the model to predict which team is more likely to score the next goal. Let’s call this p = P(T|s), where T represents the team containing the player we’ll be looking at.
- Now remove the information for the player we’re evaluating (who I’ll call Bob), and ask the model to predict which team it thinks is likely to score the next goal. Let’s call this p^{*\text{Bob}}=P(T_{\text{Bob}}|s^{*Bob}), where the *\text{Bob} superscript indicates that Bob is left out.
- If we take the difference between the probabilities, what we’re left with is the value Bob contributes by being where they are compared, i.e. p-p^{*\text{Bob}}=\text{the Bob difference™}
N.B. Note that we only train on gameplay periods that end in a goal, with a gameplay period starting from when the first touch occurs after a countdown and ending when a goal is scored. Gameplay periods that end with the ball hitting the ground at 0s are ignored for training.
To reiterate, we’ve defined Situational Player Value (SPV) that evaluates how much a player contributes to a specific situation by predicting which team will score the next goal.
\text{Situational Player Value} \quad \text{SPV}(s)=P(T_{\text{Bob}}|s)-P(T_{\text{Bob}}|s^{*\text{Bob}})
Investigating this stat, we’ve found that it behaves in a surprising manner. Let’s go through some gameplay.
A gameplay example
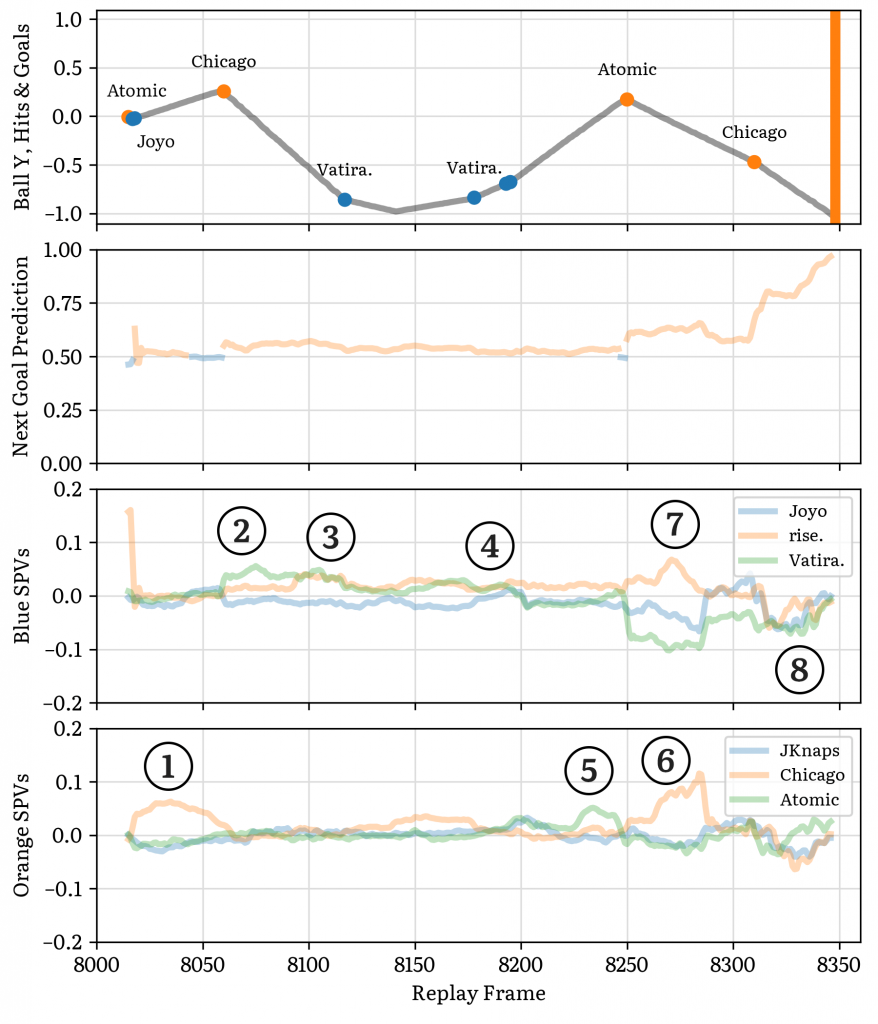
Here’s a period of gameplay from the G2 vs. Queso RLCS 21-22 Winter Major Grand Finals, from kickoff to Chicago’s goal for G2. The video is taken from Atomic’s point-of-view, and the plots on the right show the SPVs for the players (bottom two rows), the next-goal prediction from the model (second row), and the hits as well as the ball’s y-coordinate (i.e. where it is between the orange and blue goals, with -1 being the blue goal and +1 being the orange goal).

Following the play from kickoff, we see that the ball rolls out to Chicago who is the last man on kickoff. He’s credited with a good SPV until he hits the ball (➀). Vatira follows up, and has a good SPV until he hits the ball on the backboard (➁). Rise is at the back with him and is also duly rewarded with SPV (➂). As Vatira brings the ball out and clears, he sees no significant SPV. Chicago, challenging him on the wall (➃), sees a mild increase. Vatira’s last loose touch is met by Atomic as the last player on G2. Atomic is rewarded with good SPV until he hits the ball (➄). After that, Chicago, taking the aggressive rotation swinging by the Queso goal, is the important player and has significant SPV until he turns to shoot the ball (➅).
Before Chicago’s shot, the Queso defence was disorganised (➆). Rise the only player with SPV above 0. Joyo has a slight negative score as he’s demoed while Vatira falling in the G2 half has a large negative score. After Chicago takes his shot, the SPV model suggests that Queso are caught out, with all of them getting a negative SPV (➇).
This example highlights some key findings as to how the model behaves.
Key findings about SPV
Firstly, we find that this model credits the player about to hit the ball, especially in situations where it’d be especially bad if they didn’t. Chicago collecting the ball off kickoff was very important, with Queso potentially getting a good attacking opportunity if Chicago had gotten the other big boost pad off kickoff (on his right side). Atomic and Vatira as the last players collecting the ball were also given positive SPV. However, once these players touched the ball, their SPV usually fell to 0. With their teammates in safer positions and the opponents off the ball, the player’s position ceases to be important.
The model also punishes players in irrelevant positions. Vatira’s journey into the G2 half left him far from the play and unable to contribute to Queso’s defence, and this was highlighted by a large negative SPV. Even Joyo’s respawning-after-being-demoed state was considered better, although also suboptimal.
Successful dribbles, passes, and shots are also not rewarded by SPV. After all, it doesn’t really matter where Chicago was after he took his shot. In fact, it would’ve been better if he were waiting at the edge of the box for a potential rebound as opposed to recovering and adjusting his car.
Here, let me emphasise one detail about the SPV calculation: when the model makes its prediction with the player left out, it does not consider it a 2v3 unfair game. Instead, it makes its best guess as to what will happen if it were a 3v3 game. You can think of it as implicitly considering where the player might’ve been and how things would pan out. Hence, SPV is less “what value does the player contribute”, but more of “what value does the player contribute compared to an average player”.
In this specific scenario, the model actually stopped giving Chicago a high SPV before he took the shot (➅, before frame 8290, while the shot occurred at about 8310). Perhaps the model thought that there’d very often be a player facing the goal ready to take a strong shot off the infield pass, and that Chicago’s unorthodox approach was subpar (even though it worked).
Given these findings, how does this stat inform analysis of Rocket League gameplay?
Situational Player Value is a good measure for player positioning
Situational Player Value is a good measure for player positioning: it answers the question of how often is the player positioned in a manner that is both important for the gameplay and is better than what an average player would do?
It does not, however, tell us what the player managed to do on the ball. It doesn’t have the finetuned capability to detect that the player has shaped their car for the perfect shot (as replays are recorded at 30FPS and are subject to observer latency). Thus, when the player has actually put the perfect shot on net, they will not be credited – on the frame before, the model cannot tell how good a shot will be, on the frame after, the player’s positioning ceases to be important as the ball is already bound for the net regardless of where the player is.
What’s next
In our next article, we’ll build a complementary stat that accounts for some of the weaknesses we’ve found here. We’re also integrating this analysis straight into Paragon, our replay analysis and training tool that customises your training to you by generating training scenarios directly from your games and allowing you to play them right in free play.
I’ll be rounding out this series of articles by looking at the numbers aggregated across RLCS games, and inferences we can draw for the future of Rocket League esports. If you’re at LANdon this coming weekend, feel free to find me for a discussion!
