
Identifying a bim-bam team
They was lookin’ for us, but they didn’t catch us.
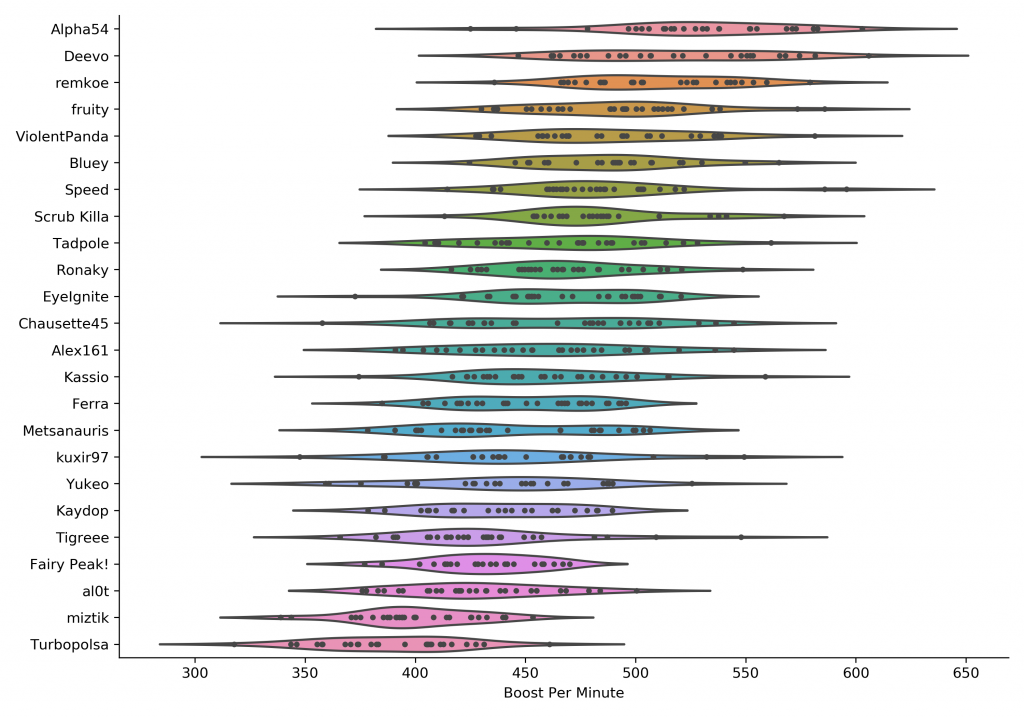
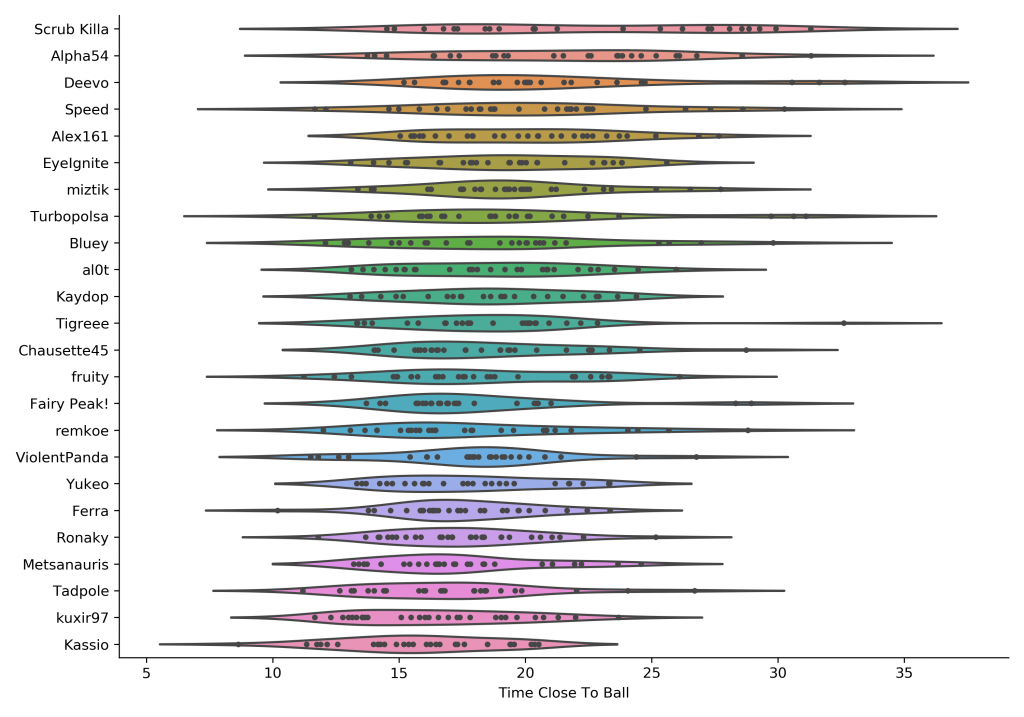
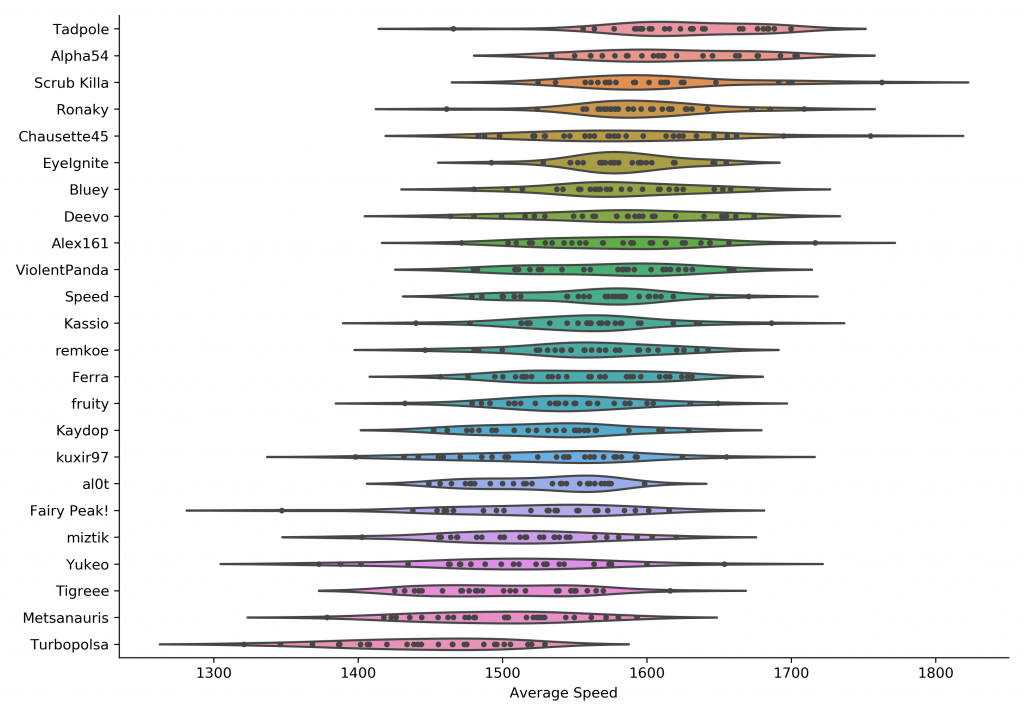
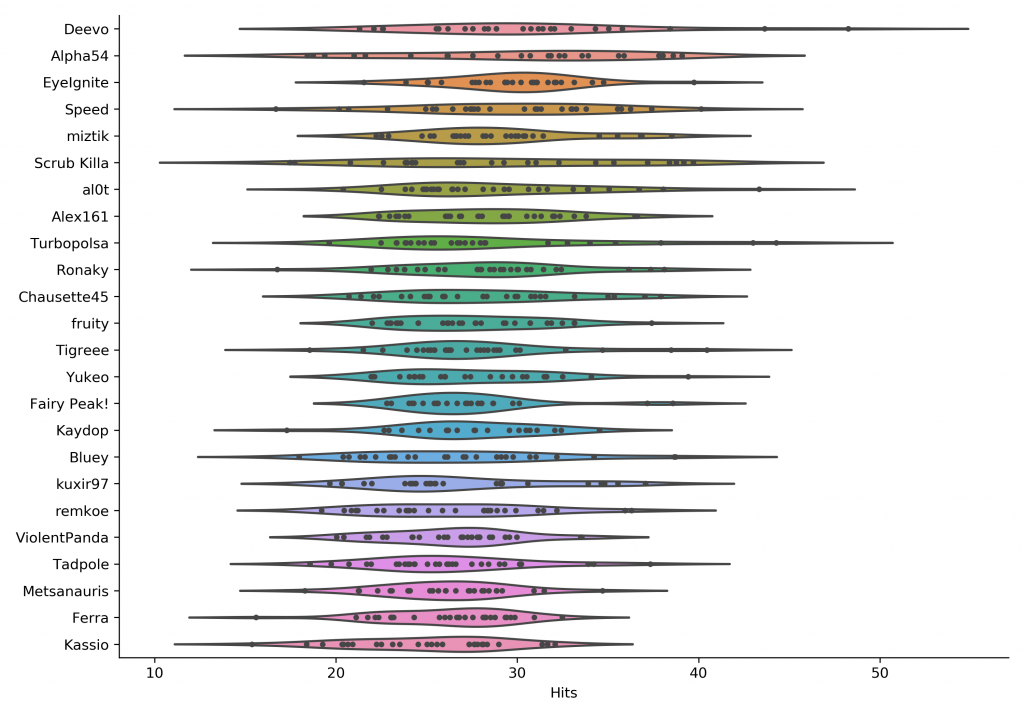
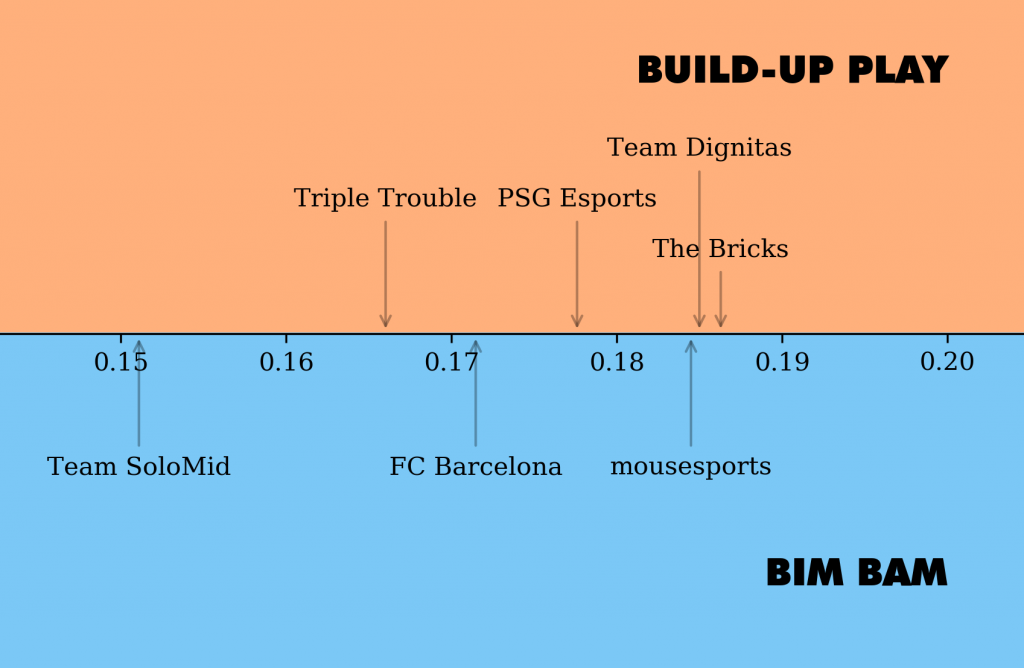
Bim-bam teams (BBTs) can be characterised by their fast-paced gameplay that seeks to overwhelm the opponents with pressure. This can be seen in their count of hits per game, average speed, boost usage, and time spent close to the ball.
This can be contrasted against teams that are more focused on build-up play which usually yields a higher average xG per shot.1 The high average xG per shot of PSG (0.214), The Bricks (0.206), and Triple Trouble (0.205) excludes them from the group of BBTs.
I consider Ghost and Dignitas to be build-up-play teams, with their low average xG per shot attributable to horrible team chemistry.
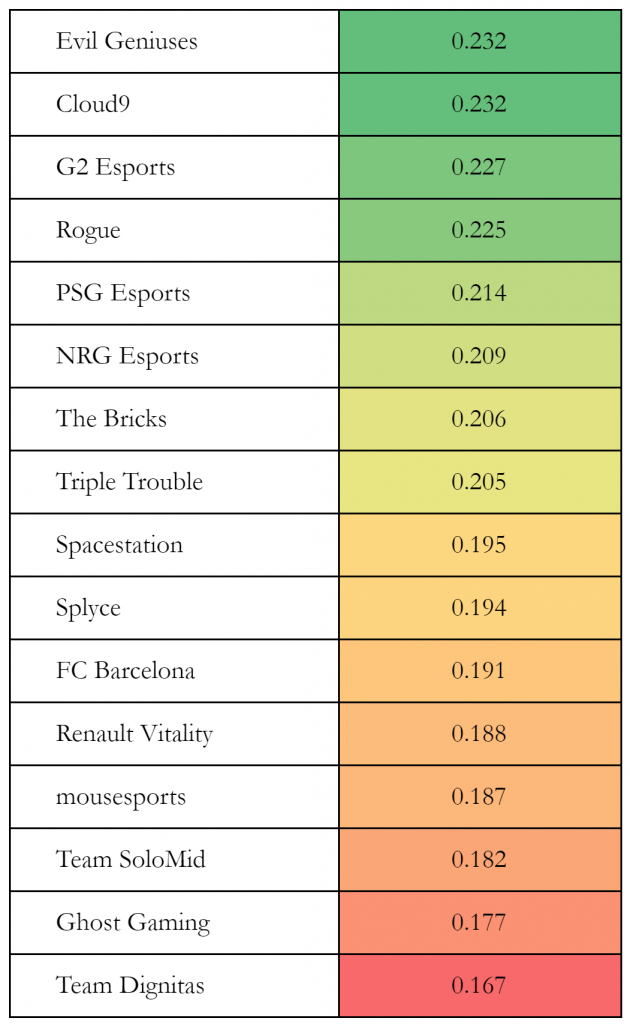
All in all, the BBTs can be identified: FC Barcelona, Team SoloMid, and mousesports.
A hint of change
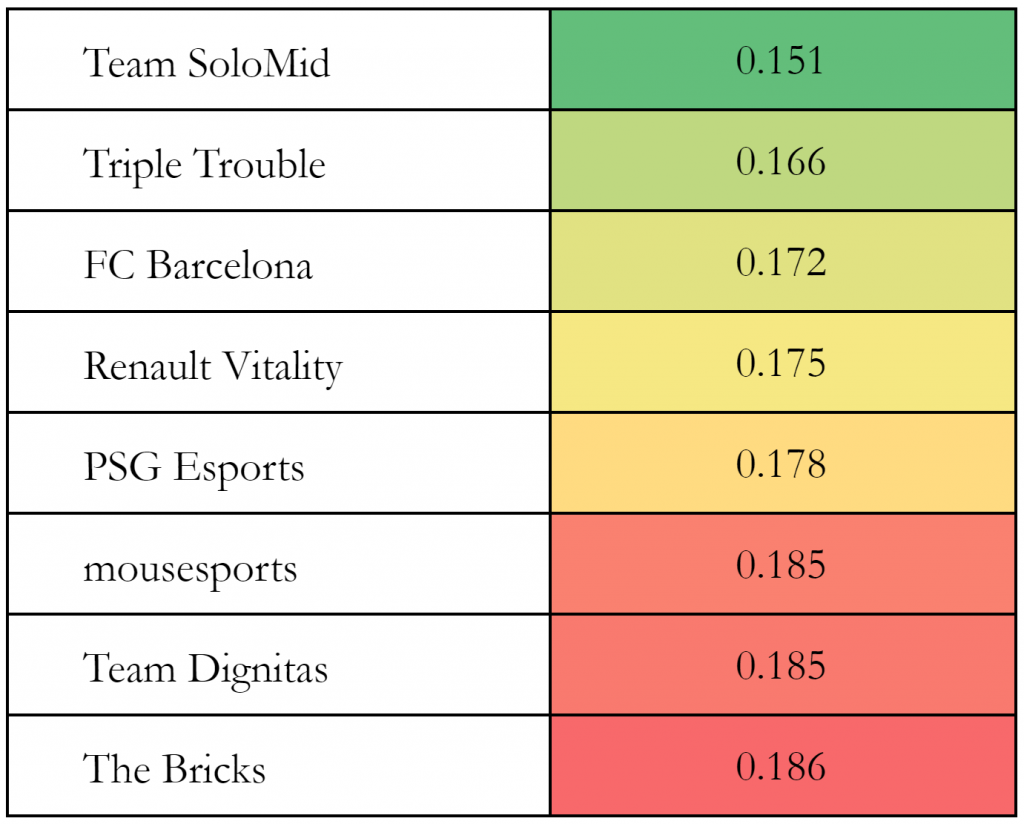
My previous analysis of RLCS S6 League Play indicated that average xGa per defence was the main indicator of the defensive ability of a team. Suppressing the opponent’s offence by not giving them space to take shots from good positions was of utmost importance.
This season, the stat fails to be the same good predictor of a team’s defensive abilities that it was last season. TSM in particular is hugely overrated here and RV does not deserve to be anywhere near mid-table.
Instead, looking at goals conceded per xGa yields a better estimate for the teams’ defensive abilities. While this stat is likely much more about individual goalkeeping skill and less about team playstyle, it is also hugely influenced by the player’s teammates. If a team’s rotation is not fitting perfectly, the defending players are generally left in worse positions.
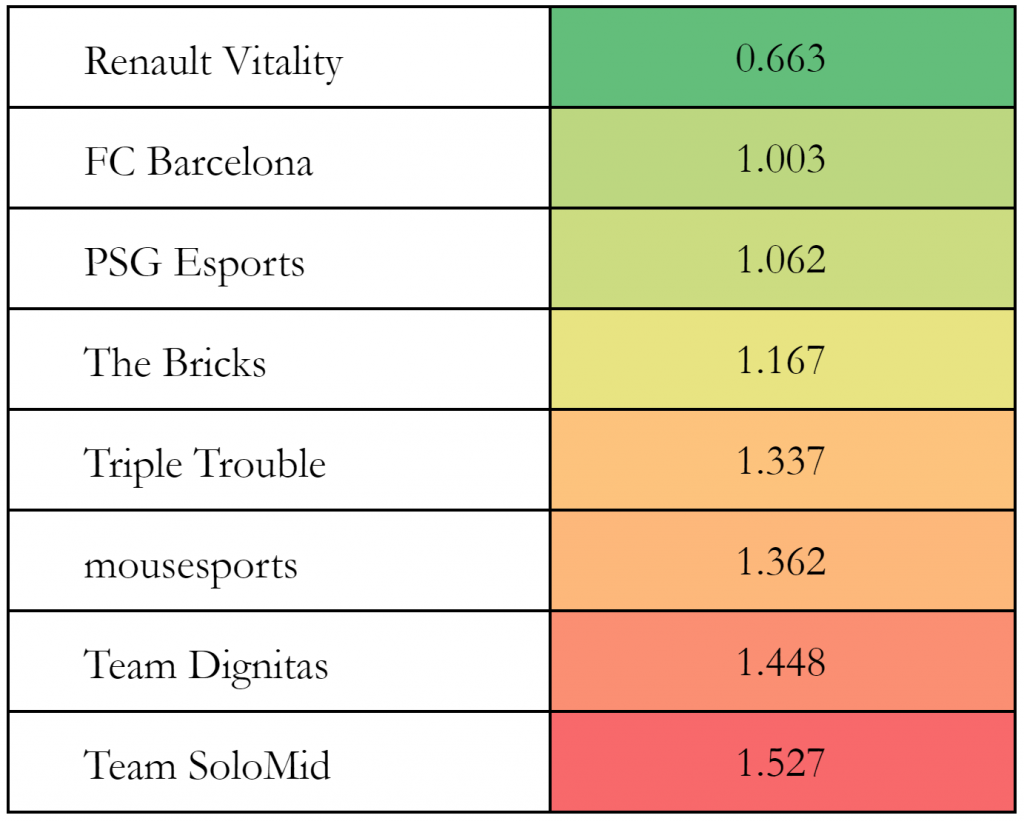
The Renault Vitality players are individually amazing goalkeepers and they leveraged that during League Play to achieve their great results. Stats show that among them, only Scrub ranks above-average in terms of speed and hits per game, while both Kaydop and Fairy Peak can be found around mid-table for those stats.
Finding success through individual goalkeeping, they are likely trying to bait in over-commits by attacking players. This marks a huge departure from the previous season’s defensive indicators of team defence which focused on smothering attacks. Whether this is a meta shift or an idiosyncrasy of a team consisting of great goalkeepers is yet to be seen, but initial signs (in particular the match-up advantages between playstyles discussed below) point to a meta shift, with individual players reaching a skill level where they are all more confident in their goalkeeping.2
The narrative
I seen hundreds of men come by on the road an’ on the ranches, with their bindles on their back an’ that same damn thing in their heads … Ever’body wants a little piece of lan’.
So what happened with EU League Play? Were EU teams as inconsistent as they were talked up to be or were there match-up specifics that hugely influenced games?
At first glance, some of these results do seem ridiculous — TT and TSM have literally opposite results (i.e. every other team won against one and lost to the other.3
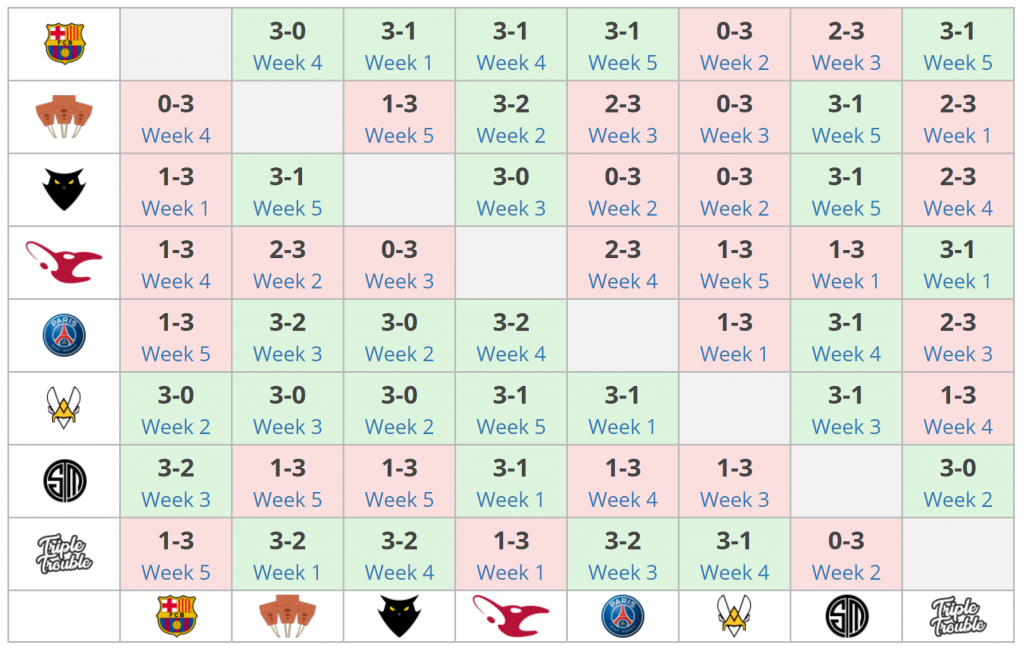
But is there a method to this madness?4
A closer look at the teams TT lost to shows that they’re all BBTs. Therefore, a plausible explanation for TT’s results can be inferred. With TT being a new roster involving a rather hesitant Kassio (replacing the undeniably more confident Speed), they suffer significantly when facing the fast-paced pressure of BBTs.
On the other hand, TSM can be seen as the best among the BBTs by getting wins against them (while getting the win over TT due to a match-up advantage).
PSG > Dig > Bricks forms a transitive sequence of build-up-play teams with Bricks defeating mouse and TSM, Dig getting an extra win against the Bricks, and PSG getting an extra win against Dig.
Interestingly, it seems that team-defence (i.e. average xGa per defence) is significant in ranking teams within their playstyles – i.e. when only considering the BBTs (of TSM, Barca, mouse) or when only considering the build-up-play teams (of TT, PSG, Bricks, Dig).
TSM > FCB > MOUZ, TT > PSG > DIG > BRICKS
This can be summarised into four main rules:
- Build-up play > pure bim-bam (of TSM, mousesports. Barca is specifically excluded due to their more passive third man.)
- TT has a match-up disadvantage against BBTs
- Barca bim-bam good but TSM bim-bam > other bim-bam
- Team-defence (average xGa per defence) explains results between teams of similar playstyles
- RV took week 4 off
NA and DH Dallas
“Gregan.” “Yeah?” “I done another bad thing.” “It don’t make no difference.”
The above average xG per shot table shows that NA teams focus on getting easy shots much more than EU teams (either that or their defences do not focus on limiting chance creation by the opponents). This makes it hard to split the NA teams into two categories and do a similar analysis.
Similarly, the results of DH Dallas is subject to many situational factors. RV’s recent form and performance at Dallas is suspect and it’s hard to tell how much of it can be attributed to their manager being unwilling to provide basic sustenance. Complexity and mousesports are rosters that did not play in RLCS League Play.
At the end of the day, it is up to the teams to do their homework on opponents, to perform during tournaments, and to adapt during a series.
This analysis has explored match-up advantages between playstyles in EU and possible explanations for the results of EU League Play.
League Play provides a rather clean dataset to analyseand further work will have to be done to analyse the more-noisy limited datasets from tournaments.
- Expected goals as a stat is introduced and explored in this series of articles.
- This also matches trends of decreasing shooting percentage for higher ranks and higher skill levels; shooters and goalkeepers both get better, but goalkeeping improves more than shooting.
- So do mousesports and RV, but this only involves one upset.
- No, Method is an RLRS team.